You can now add custom visuals to your application runs. Add custom charts using the Plotly or Chart.js rendering library, or add custom interactive maps based on GeoJSON data. Visuals can be added to any custom application by following the required schema outlined in the Custom visualizations documentation.
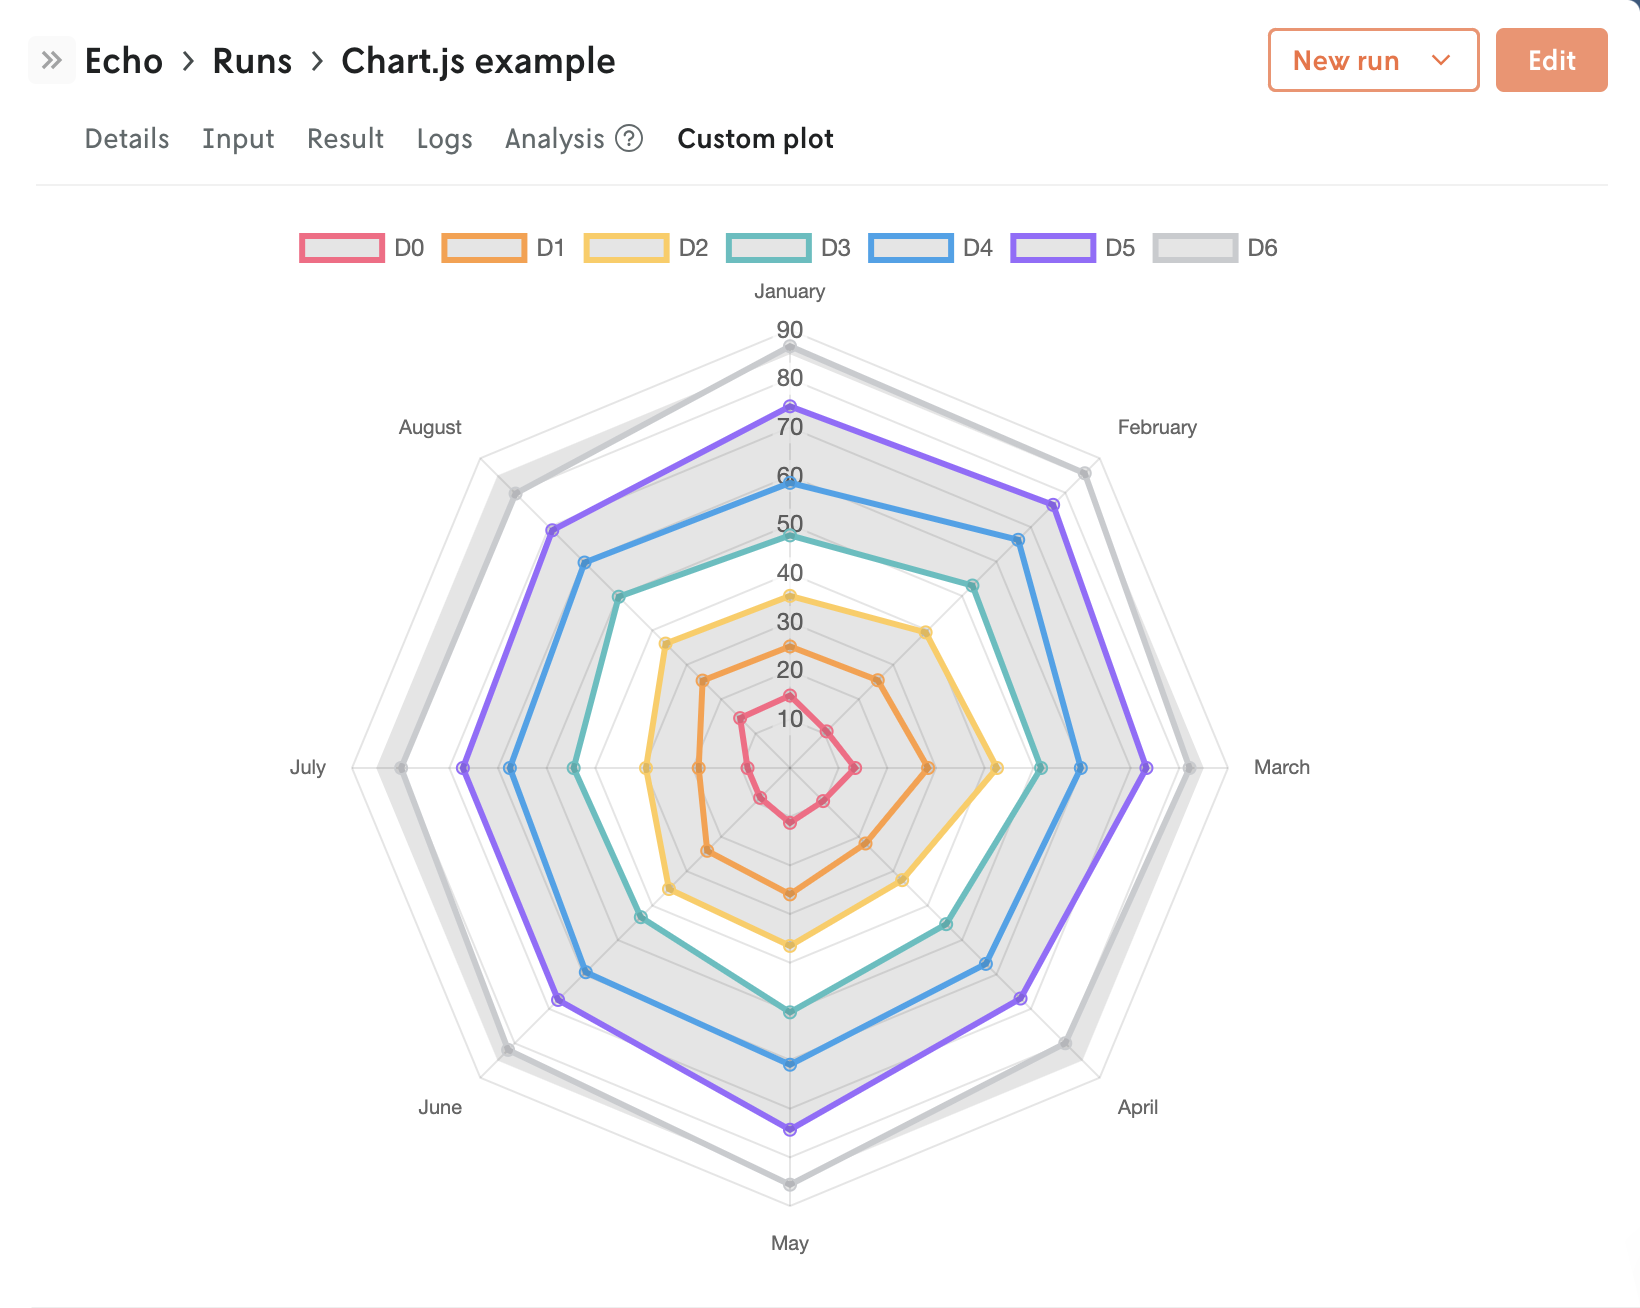 Sample of a Chart.js render for an application run.