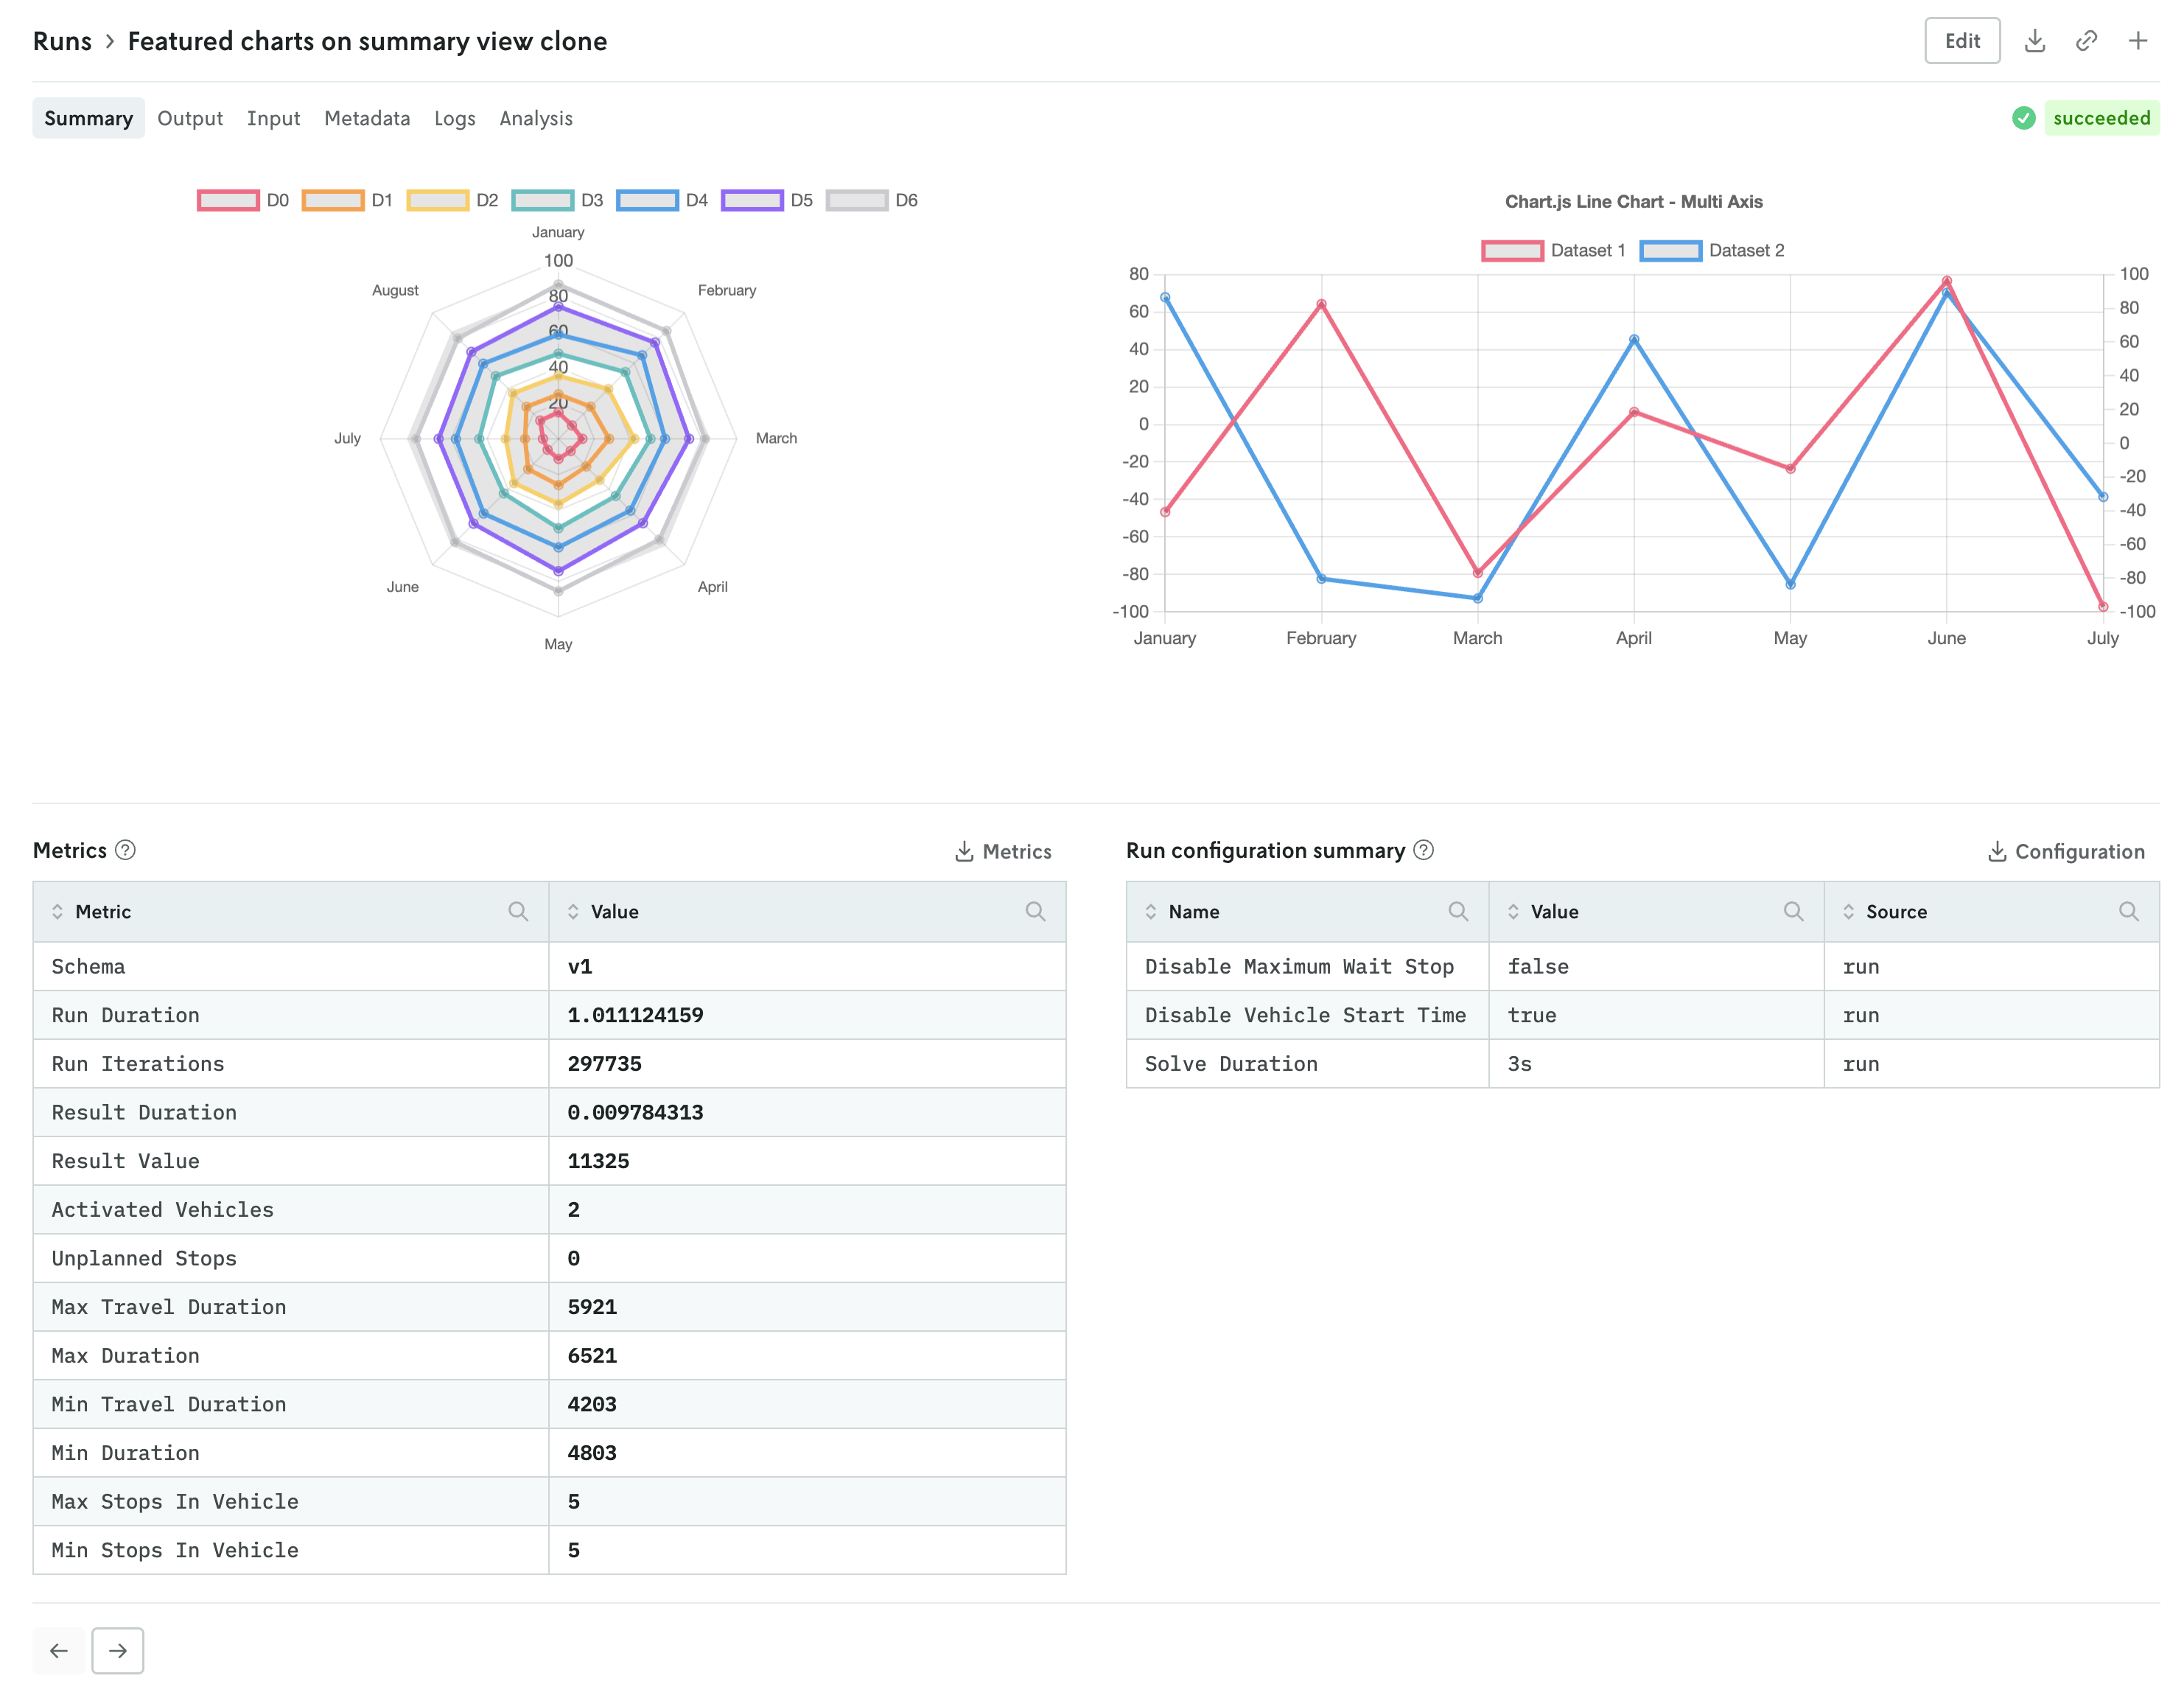
You can now set specific custom run visuals to appear on the summary view of the run details view. They will appear in a top row above the metrics and run options summary tables.
The custom visuals that appear on the summary view follow the same schema with the addition of a slot property. First, you must specify that the custom run visual should appear in the summary view with the "type": "summary-tab" designation, then you define the order with the slot property. An example of specifying a single custom visual is shown below:
You can specify up to three custom visuals for the run summary view. The slot property can have the values 1, 2, or 3:
1specifies that the visual will be on the left,2specifies that the visual will be on the right if two, in the middle if three, and3specifies that the visual will be on the right.
Note that the visuals will automatically adjust for more narrow screens (e.g. mobile devices).