See the new metrics convention as the recommended way to add custom metrics to your run output. The metrics convention is a completely flexible way to add and track any relevant metric from your run without having to fit it into an existing structure.
The statistics convention is a way to surface certain metrics in your system to Nextmv Platform. The custom metrics defined with the statistics convention are displayed on the run summary view and the run history table views, and can be used to compare runs and measure experiment outcomes.
Run format
Statistics can be defined for json format runs by adding them to your JSON output as a top-level statistics key. For multi-file runs, the statistics must be included in a single JSON file that is mapped in the app manifest’s output statistics path.
json
An example of how statistics would be defined for a json format run is given below.
Note the top-level statistics block alongside options, solutions, etc.
multi-file
An example of how the same statistics shown above would be defined for a multi-file format run is given below.
First, the file in which the statistics are stored would need to be defined in the app manifest:
Then, the statistics.json file would have the following contents:
Note that the top-level key in the JSON file above is statistics; this is a requirement.
Schema
The statistics convention has some requirements and a set hierarchy for defining statistics. There are four potential top-level properties:
schema(required) is the version of the convention. This is required and indicates which version of the convention is used (v1is the only accepted value).run(optiona) contains statistics about the run itself — for example the total duration of the solver and number of iterations.result(optional) contains statistics about the result of the run — for example the objective value.series_data(optional) contains time series data for the run, such as the progression of the value function over time.
Other notes:
- All numerical values are interpreted as floating point (IEEE 754) values. This includes the special string values
"nan","inf","+inf"and"–inf"as JSON does not support these values natively. - The maximum size of the statistics object without unnecessary whitespace is 10kb.
The four top-level properties of the statistics schema are outlined below in more detail, including how you add custom statistics.
schema
A string that determines the structure of the statistics object. As mentioned above, this property is required and must be "v1".
run
An object that can have the following properties:
| Key | Type | Description |
|---|---|---|
duration | float | The self-reported time that the solver ran in seconds. Optional, but must be a finite and positive number. |
iterations | int | The total number of iterations. Optional, but must be a positive number. |
custom | object | Can contain any arbitrary structure defined by the user. By convention all information here applies to the completed run and only numeric values are interpreted, the rest is ignored. All keys within the object must only contain alphanumeric characters, _ and -. The minimum length of a key is 1 and the maximum length is 60. See the Adding custom statistics section below for more on how to add custom values. |
result
An object that can have the following properties:
| Key | Type | Description |
|---|---|---|
value | float | The value of the result. Usually the objective value of the best solution. Optional. For non finite results use the special string values "nan", "inf", "+inf" and "–inf". |
duration | int | Time in seconds until that specific result was found. Optional, but must be a finite and positive number. |
custom | object | Can contain any arbitrary structure defined by the user. By convention all information here applies to the completed run and only numeric values are interpreted, the rest is ignored. All keys within the object must only contain alphanumeric characters, _ and -. The minimum length of a key is 1 and the maximum length is 60. See the Adding custom statistics section below for more on how to add custom values. |
series_data
An object that can have the following properties:
| Key | Type | Description |
|---|---|---|
value | Series (see below table) | The progression of the objective value over time (optional). |
custom | []Series (see below table) | An optional array of Series. This can be used to communicate any type of two dimensional data sequences. |
The Series type is defined as such:
Example snippet
See the example statistics below for a quick reference of the schema detailed above. The time series included shows a simple progression of the value function over time as well as more complex data like the usage of a custom operator over time.
Adding custom statistics
If you have a custom app, you may wish to add custom statistics to result.custom or run.custom.
Consider an example from vehicle routing. To add the unplanned stop count as a custom statistic, you can:
- Format the output using the
nextroutefactory formatter. - Add custom unplanned stop count to the formatted solution output.
An example of how to do this is shown below:
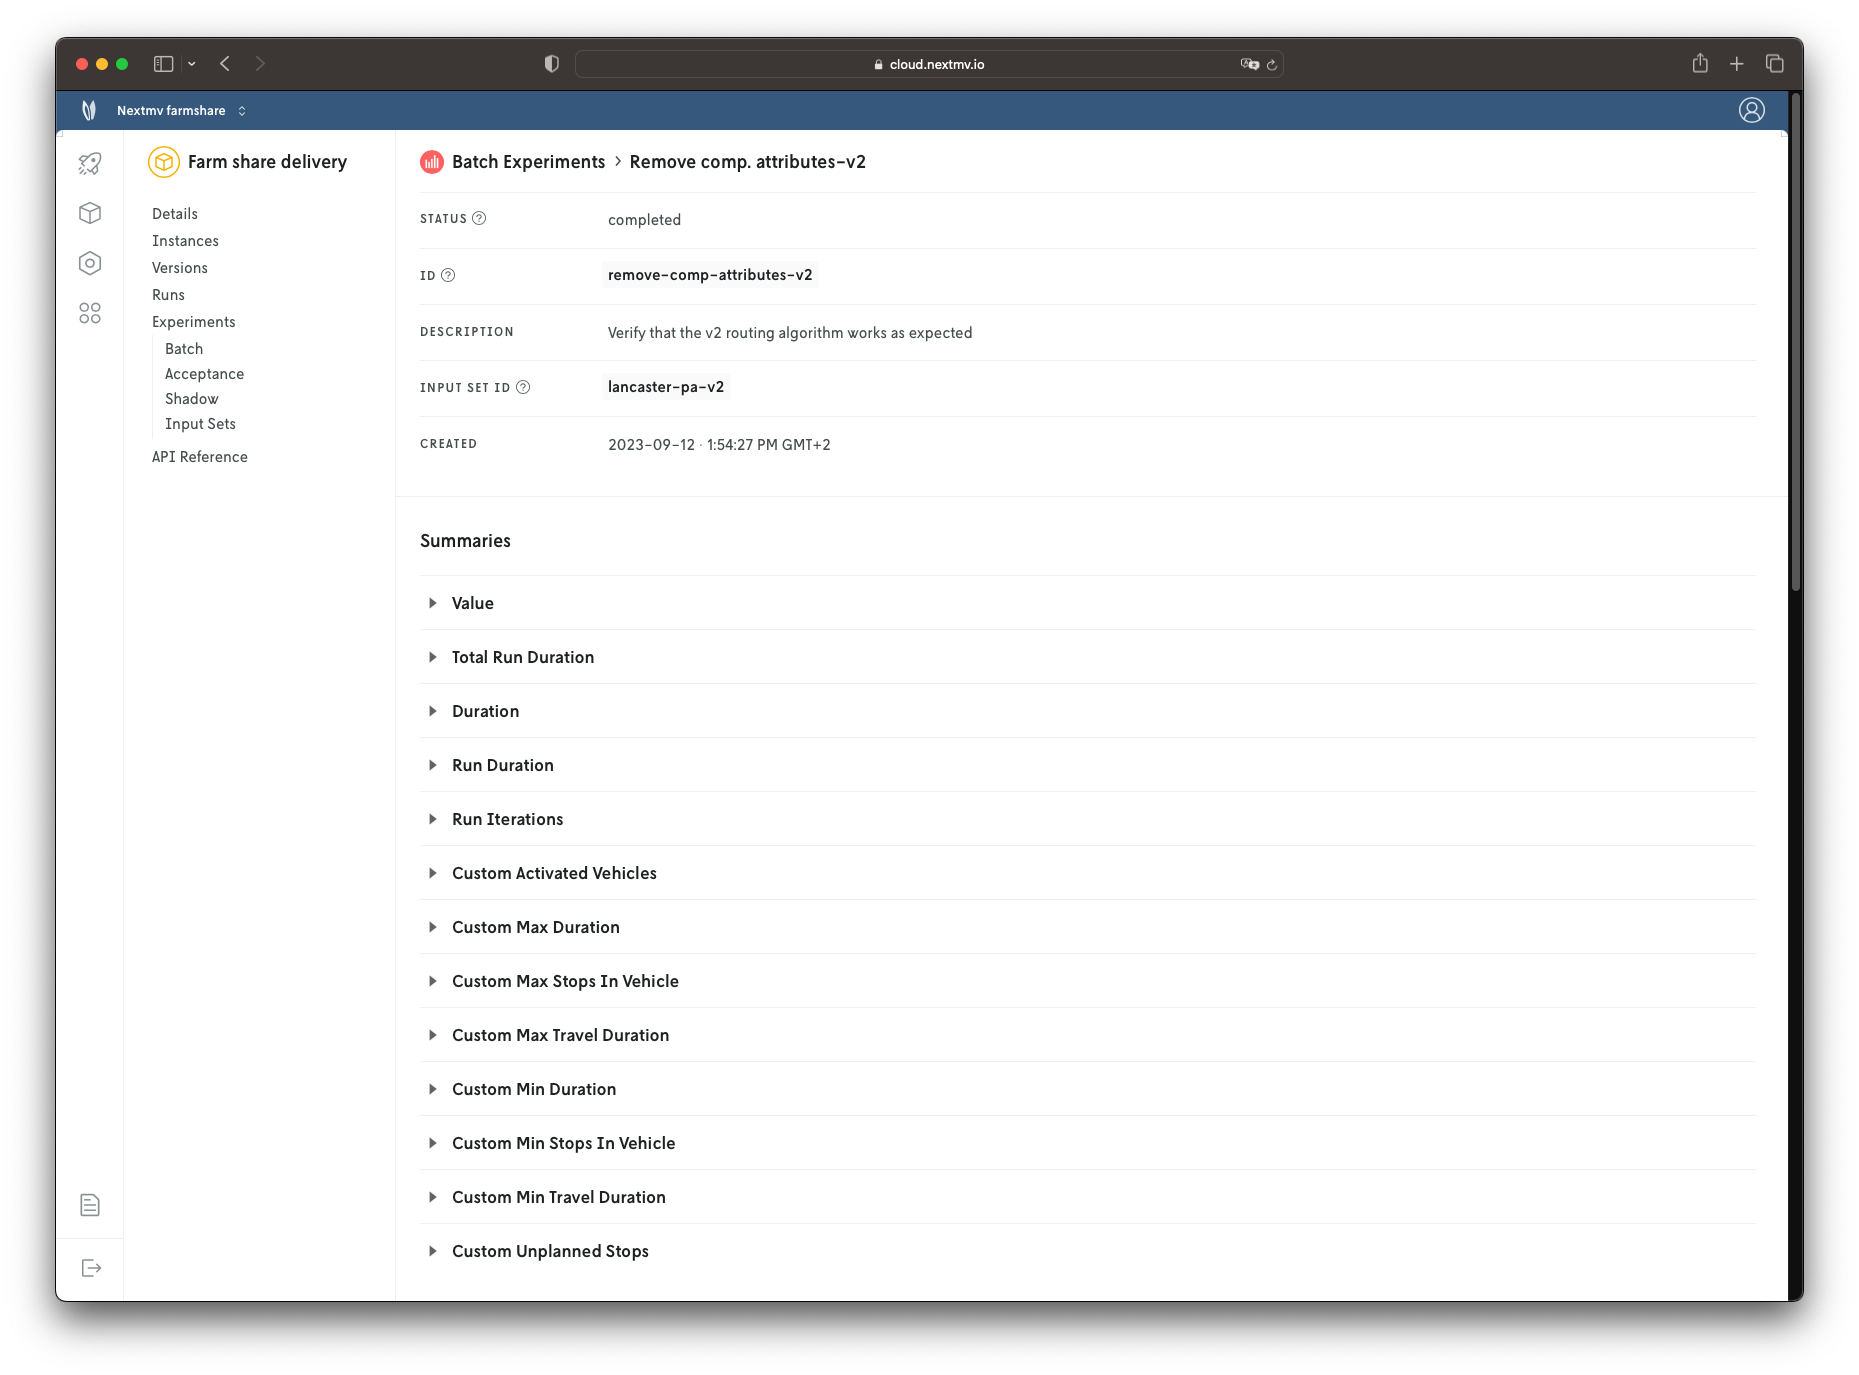
How the statistics are used
If the run output conforms to the statistics convention, the system extracts the statistics and makes them available for further processing. For example the statistics are displayed as top-level values in the run history table, and are compared in the compare run views. The statistics can also be referenced and used for analysis with the experiment testing suite.