The details view for runs was updated to better align with the data returned and viewing patterns. Summary tables of run metrics and options used are separated into their own view called Summary which is the default landing view when you click on a run. If you are documenting the objective function in your output, then a table summarizing the objective function for the run will be displayed as well.
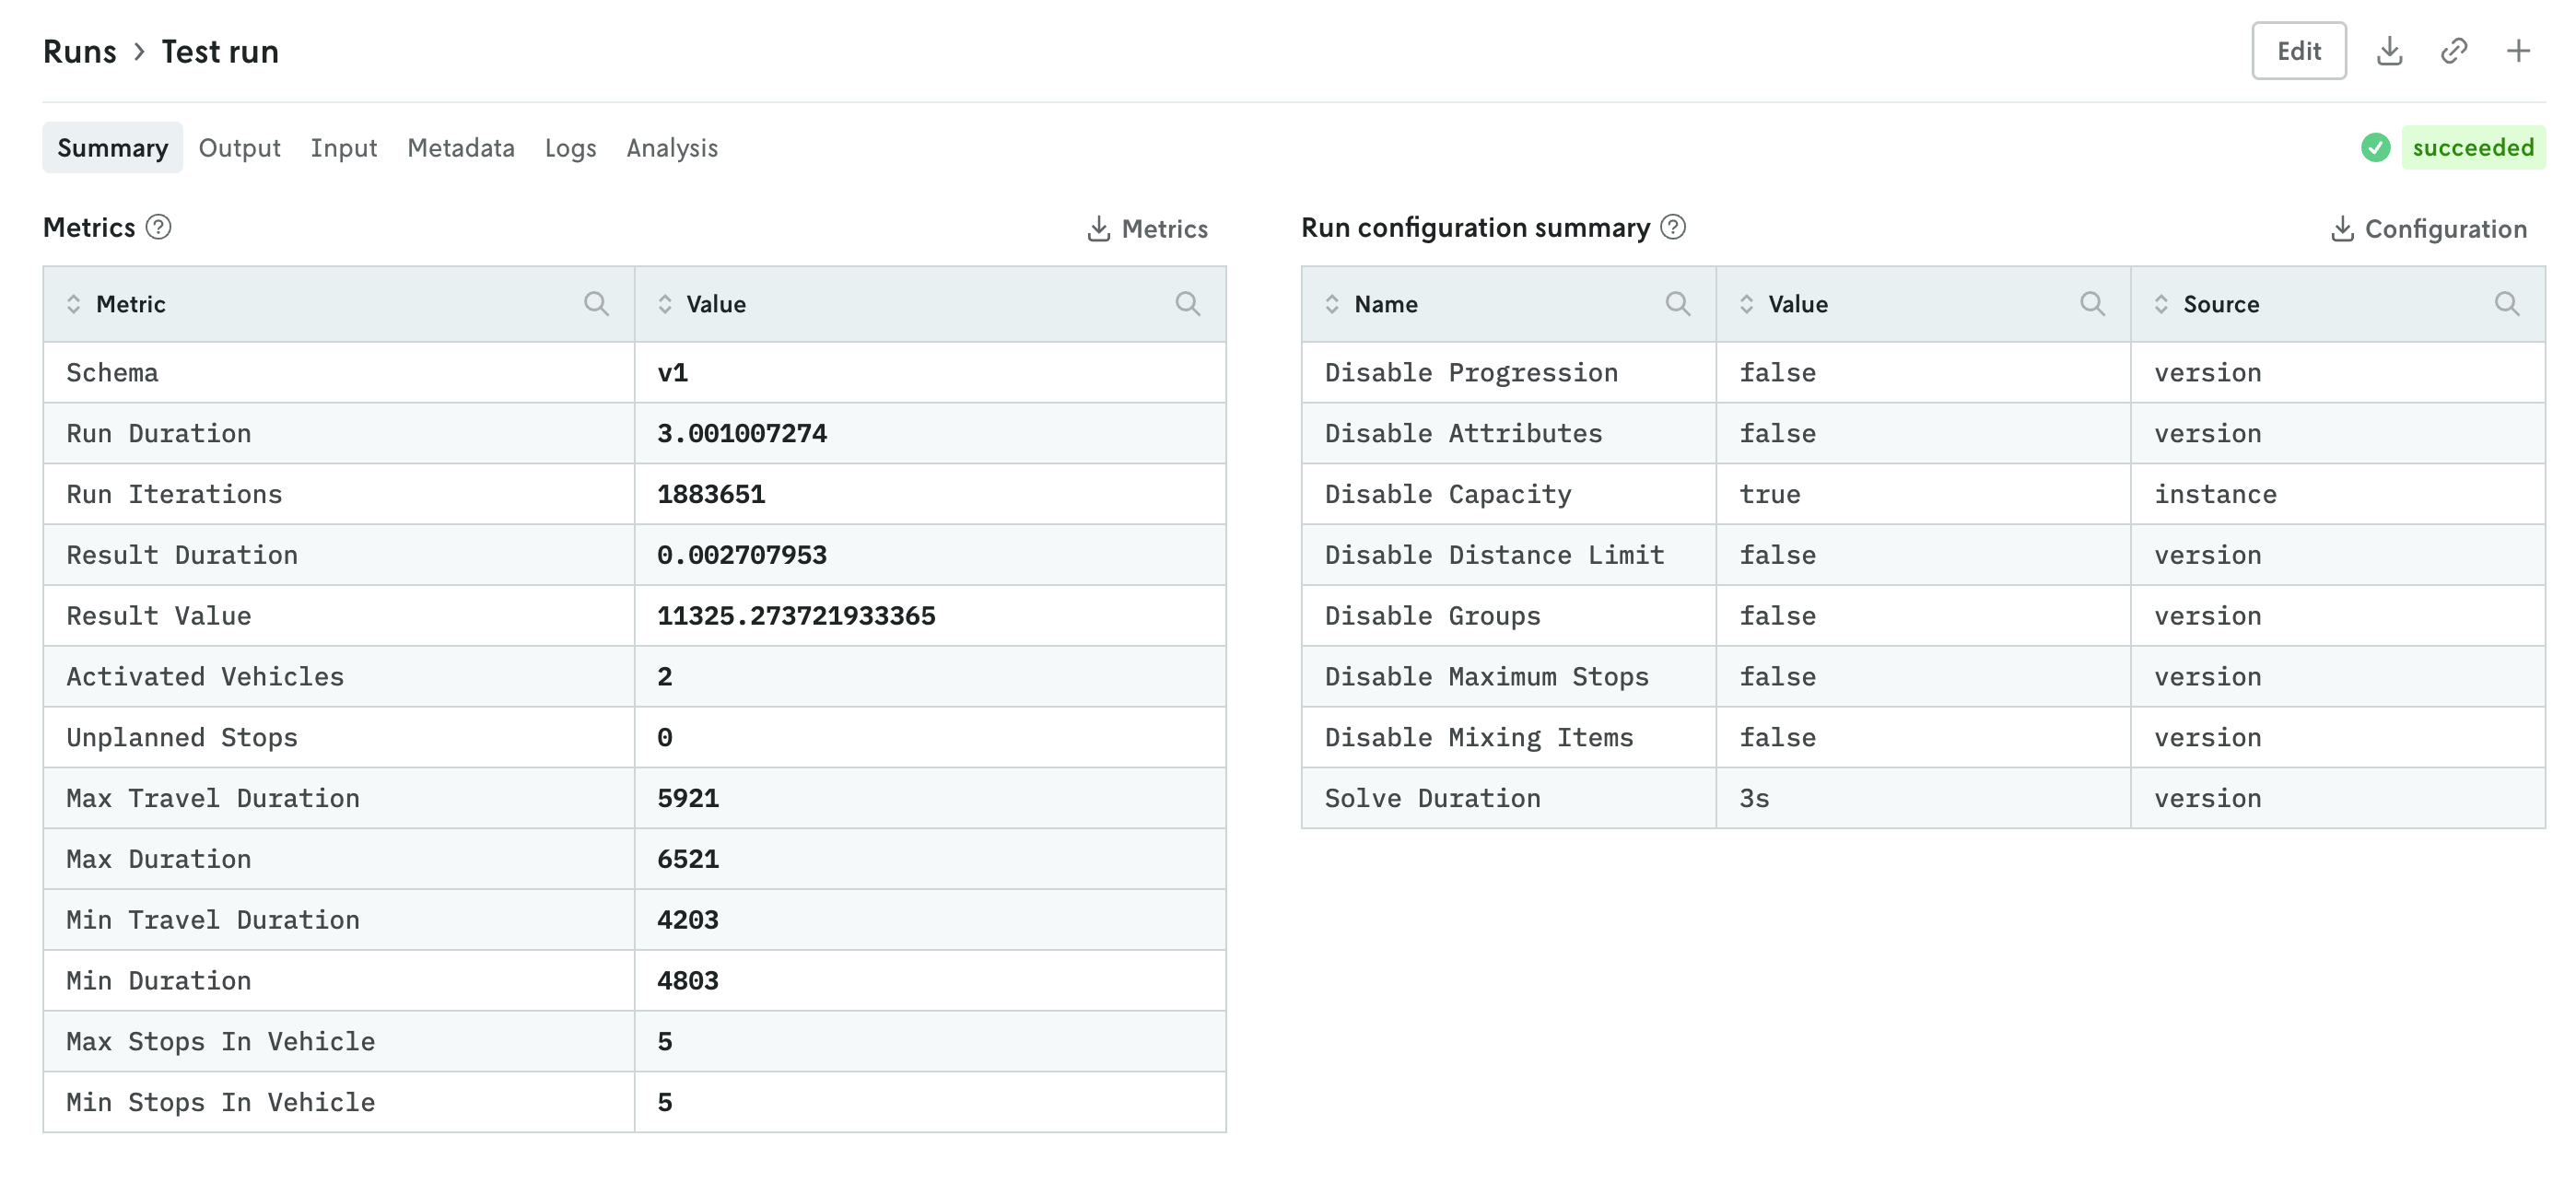
You can further enhance the summary view by adding your own visuals. See the release note for adding custom visuals to the summary tab for more information.
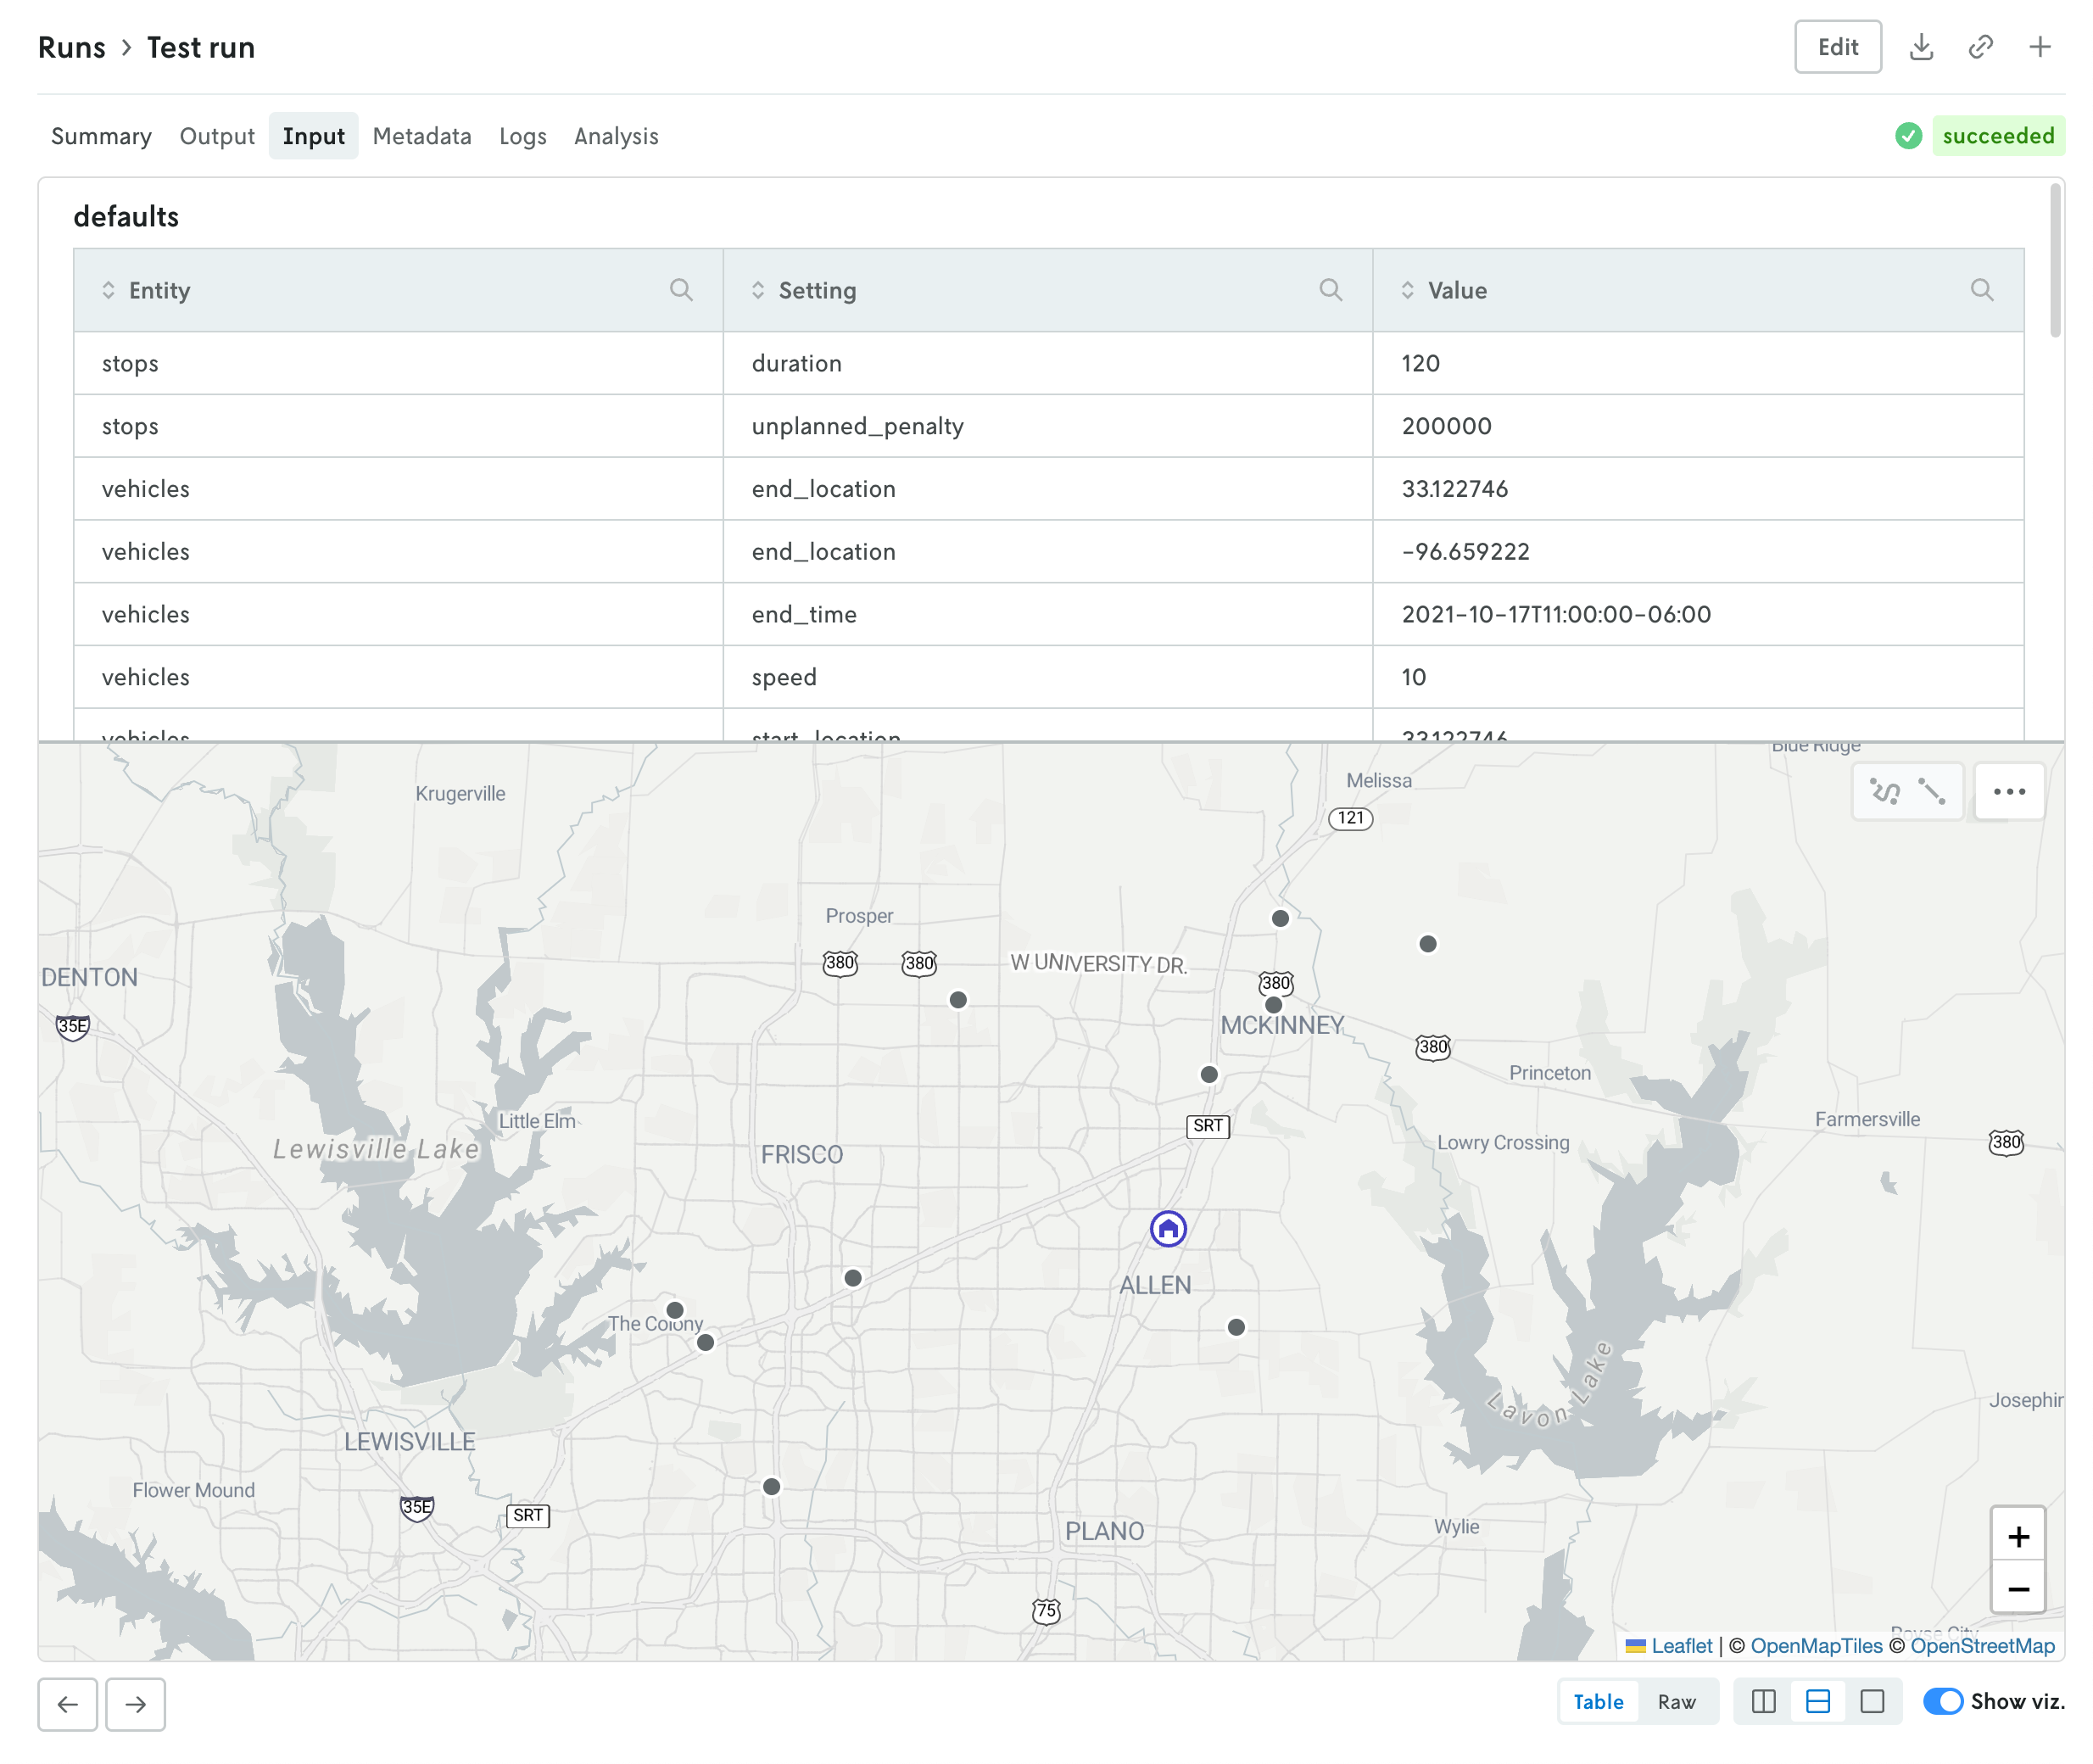
The input and output tabs have been updated with more intuitive controls for managing table and raw data views and visualizations if they exist as well.
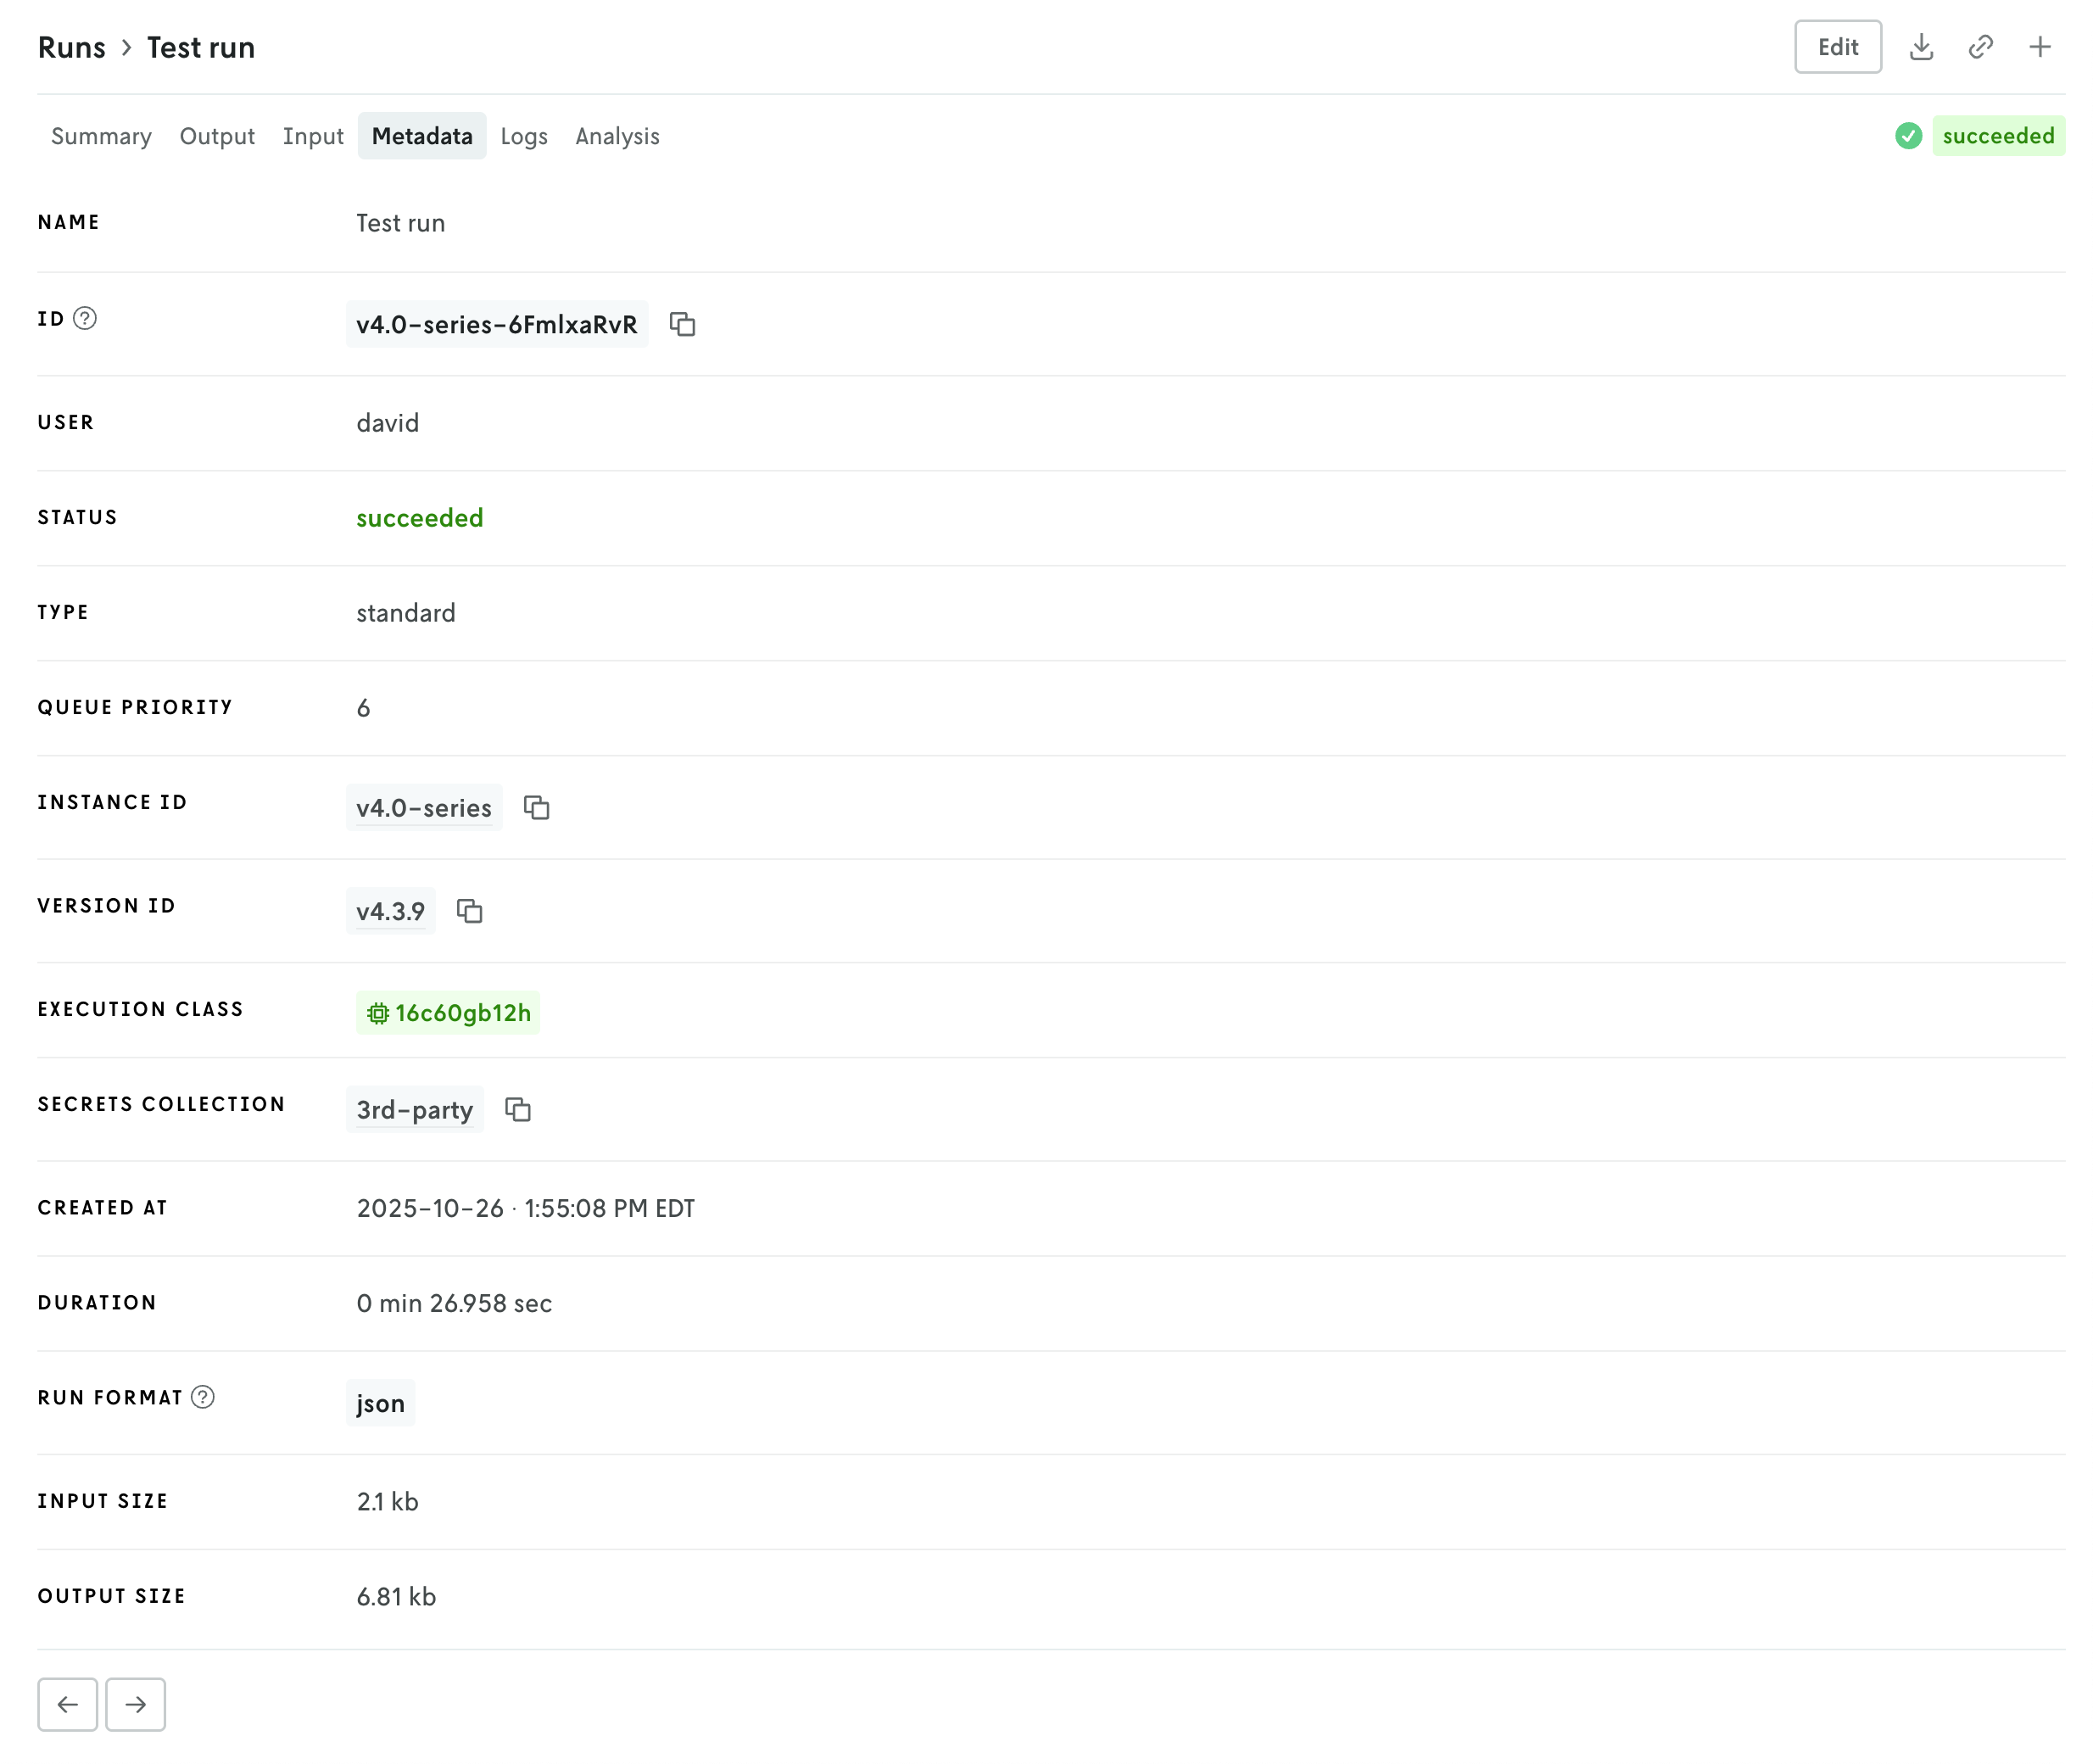
Additional views include a new Metadata view which displays a variety of information related to the run like duration, type, queuing, which version and instance were used, and so forth. The run status has been pulled out of the metadata view and displayed in the header so you can easily view the status of a run no matter which tab view is active.
Then there is a tab for viewing run logs, ensemble analysis details (if it’s an ensemble run), and series data charts if they exist (in the Analysis tab). You can navigate the different views by clicking the tabs in the header or you can use the left and right arrows in the page footer to navigate between the views.
And you can continue to edit the run, download the full input and output files, share views, or create a new run or clone the run you’re viewing using the action buttons in the header.