Using managed options with scenario tests
October 8, 2025
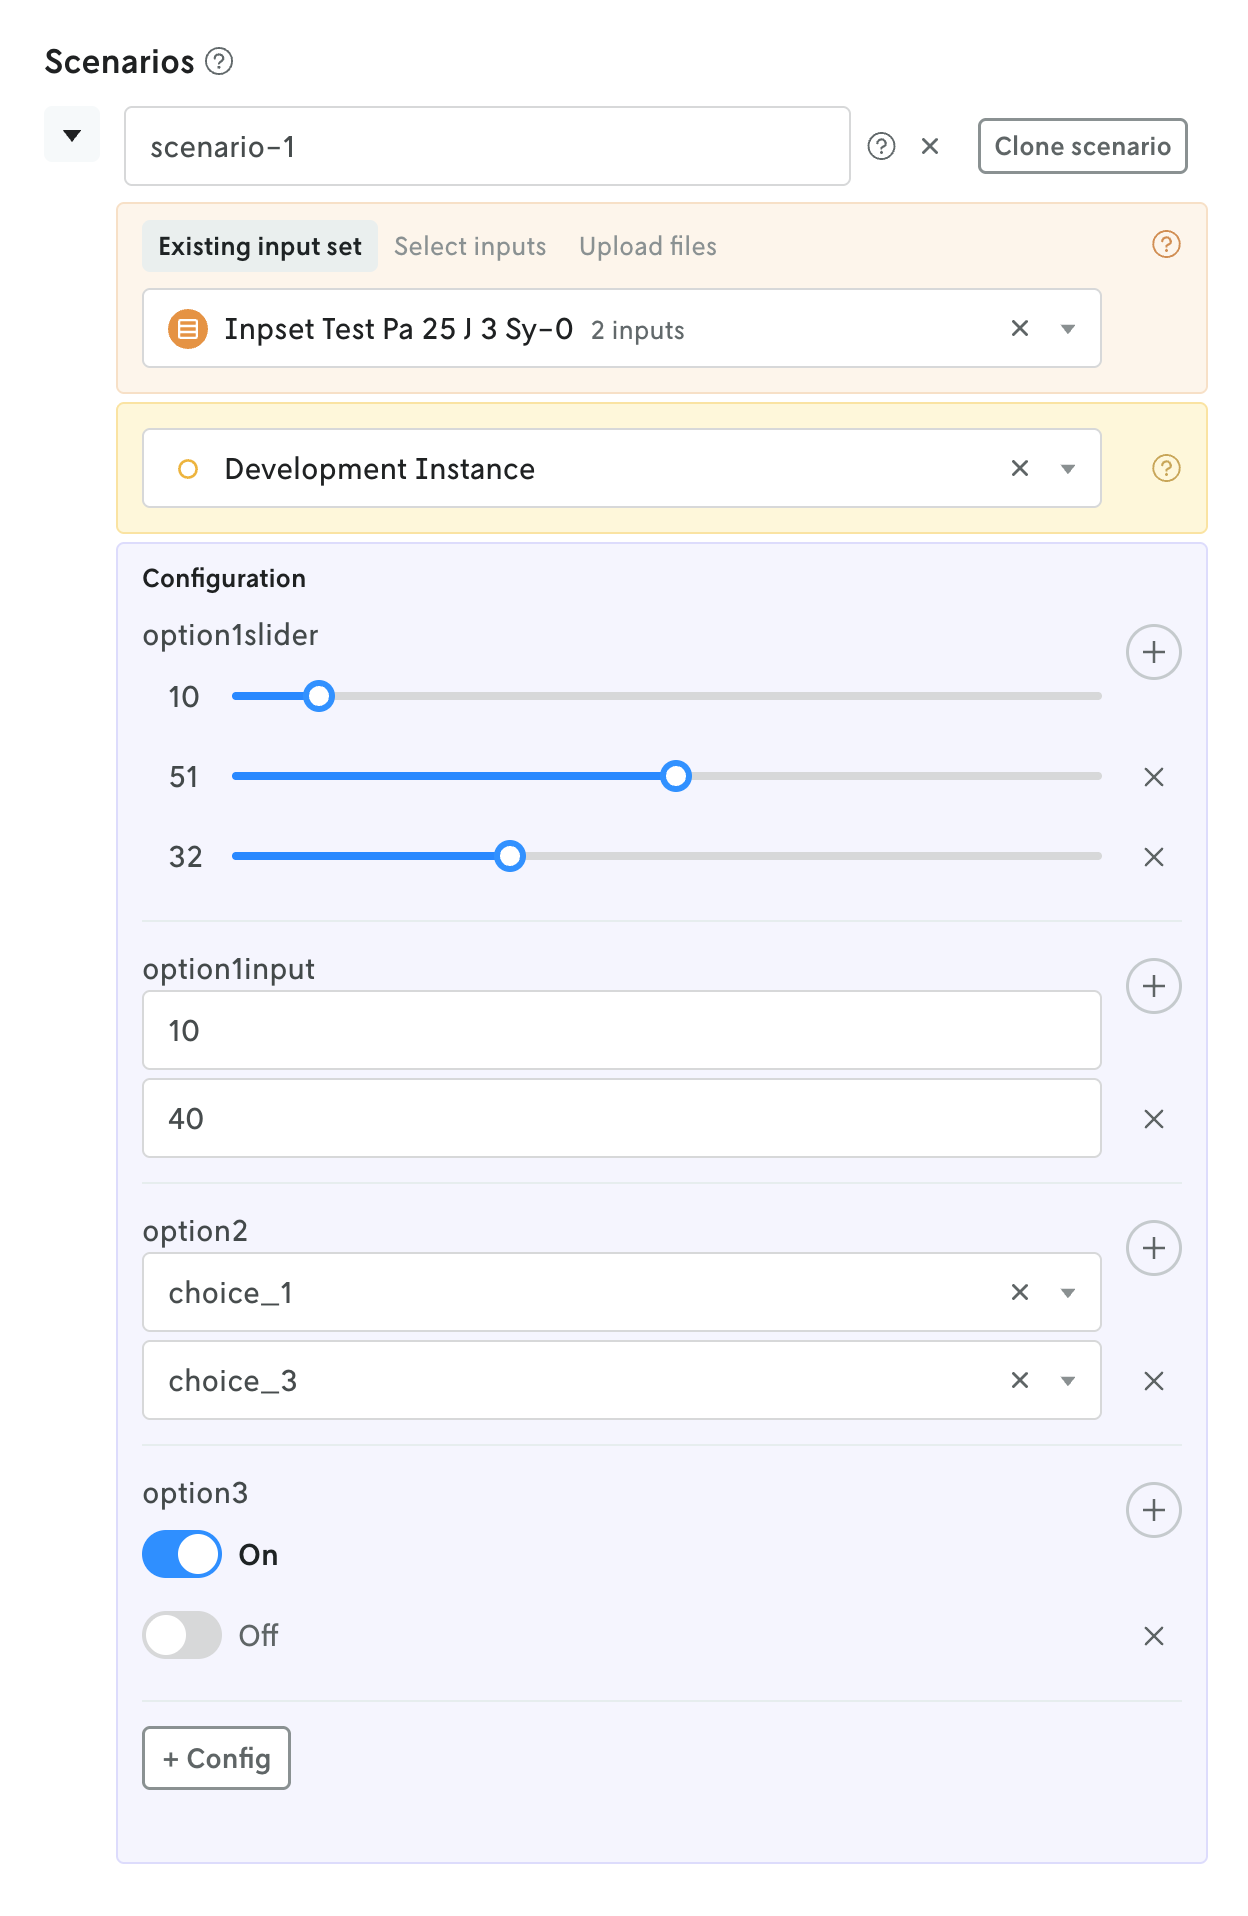
The defined options interface has been enhanced for scenario tests to allow specifying multiple values for a single option. A + button next to the defined option control allows you to add as many controls (i.e. values) for a single option as needed. And like before, these multiple values are used to create a cross-product of runs for that scenario.
nextmv-v0.32.0
October 3, 2025What's Changed
- Returns the runs of a batch experiment, adds the
list_runsmethods forApplicationinlocalandcloudby @sebastian-quintero in #144 - Moves to macos-15-intel for deprecated macos-13 runner by @merschformann in #145
- Adds the complete docs for
localexperience by @sebastian-quintero in #146 - Release v0.32.0 by @sebastian-quintero in #147
User-friendly options for runs and scenario tests
October 3, 2025
Nextmv Console supports the new managed options feature for defining model options. When you push your model to Nextmv Cloud, the defined (or managed) options will be surfaced with versions that use the model binary.
Also note that the options are made available for the app’s most recently pushed binary (active executable) and thus are able to be used immediately by the app’s managed devint and Latest instances.
When you assign a version to an instance, the options associated with that version (by way of the model binary that was attached to it) are passed through and made available on the instance. The UI displays all of the available options with their relevant controls with the default values selected if those were defined. You can accept all of the default options for the instance or add overrides for one or more options if desired (you can reset an option to its default value at any time). This method allows you to specify option overrides as defaults for certain instances.
When an instance is selected for a run, that instance’s defined options are passed through to the run. If the instance had overridden a default configuration value, that new value is shown as the option’s default value for the run. Like with an instance, you can override any of the option’s default values for the run. After the run has been created, you can view the Run configuration summary table to see which options were applied and where they came from.
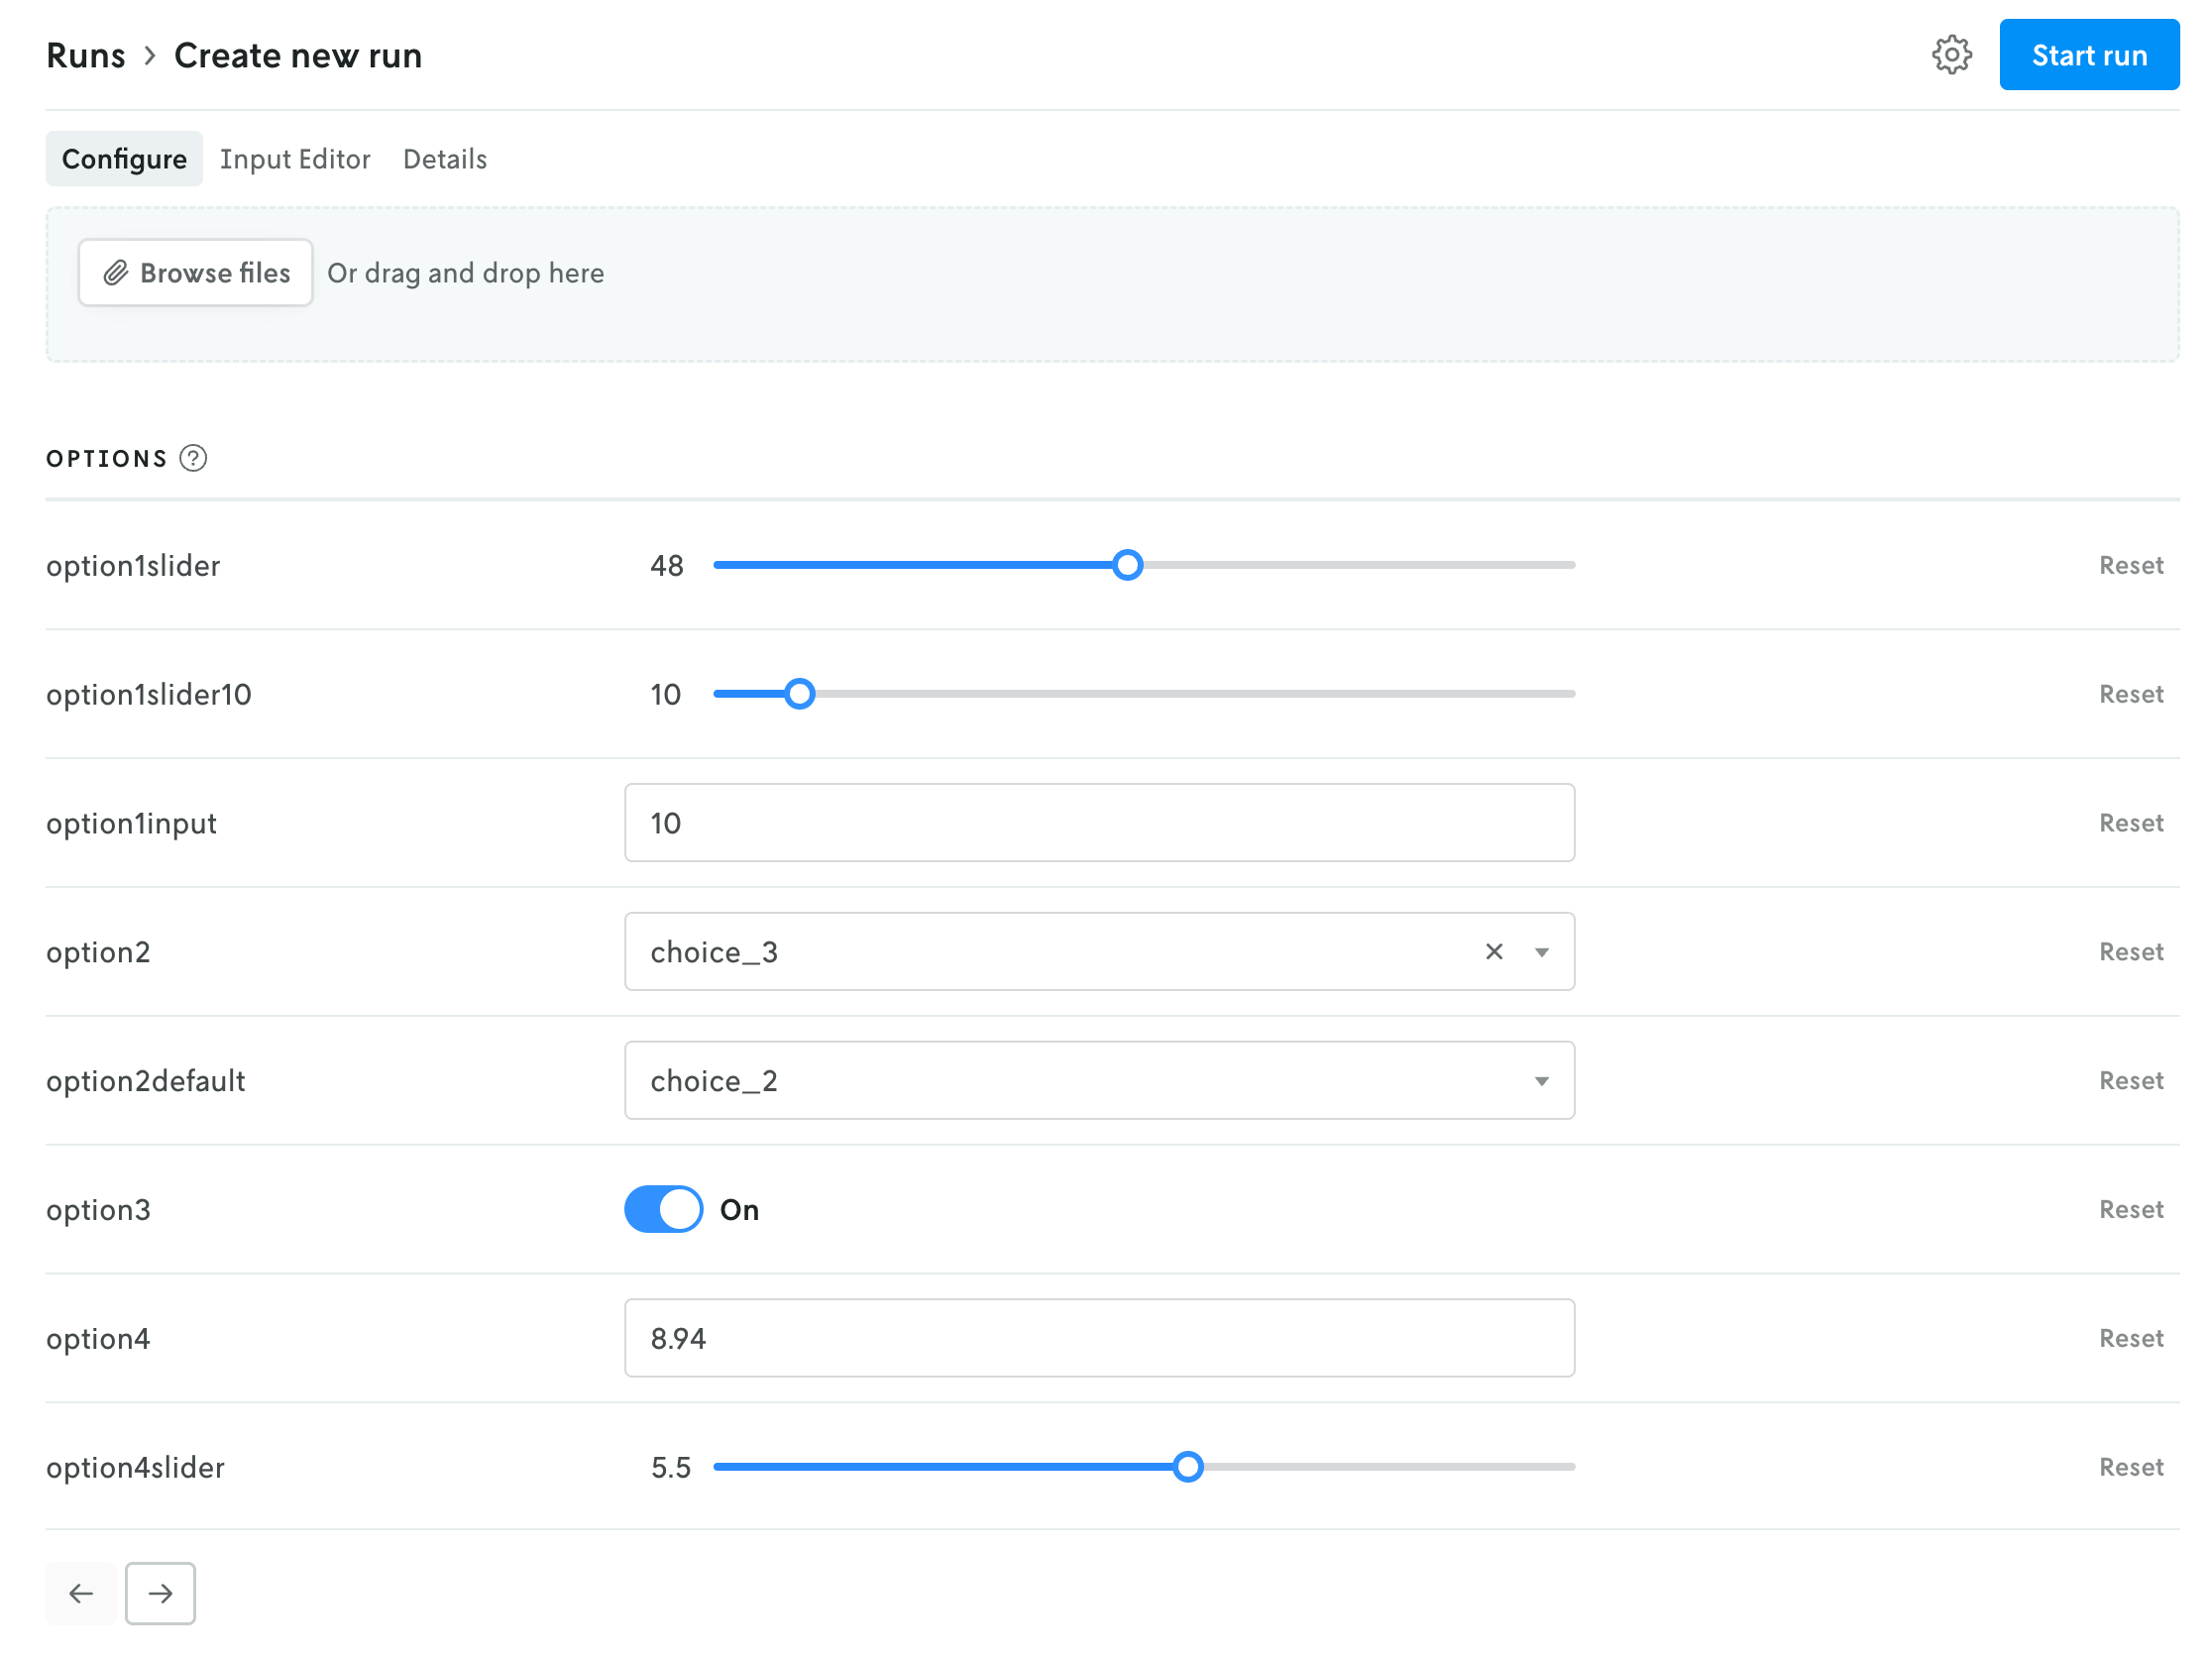 Managed options shown in the create run view.
Run options summary table
October 3, 2025
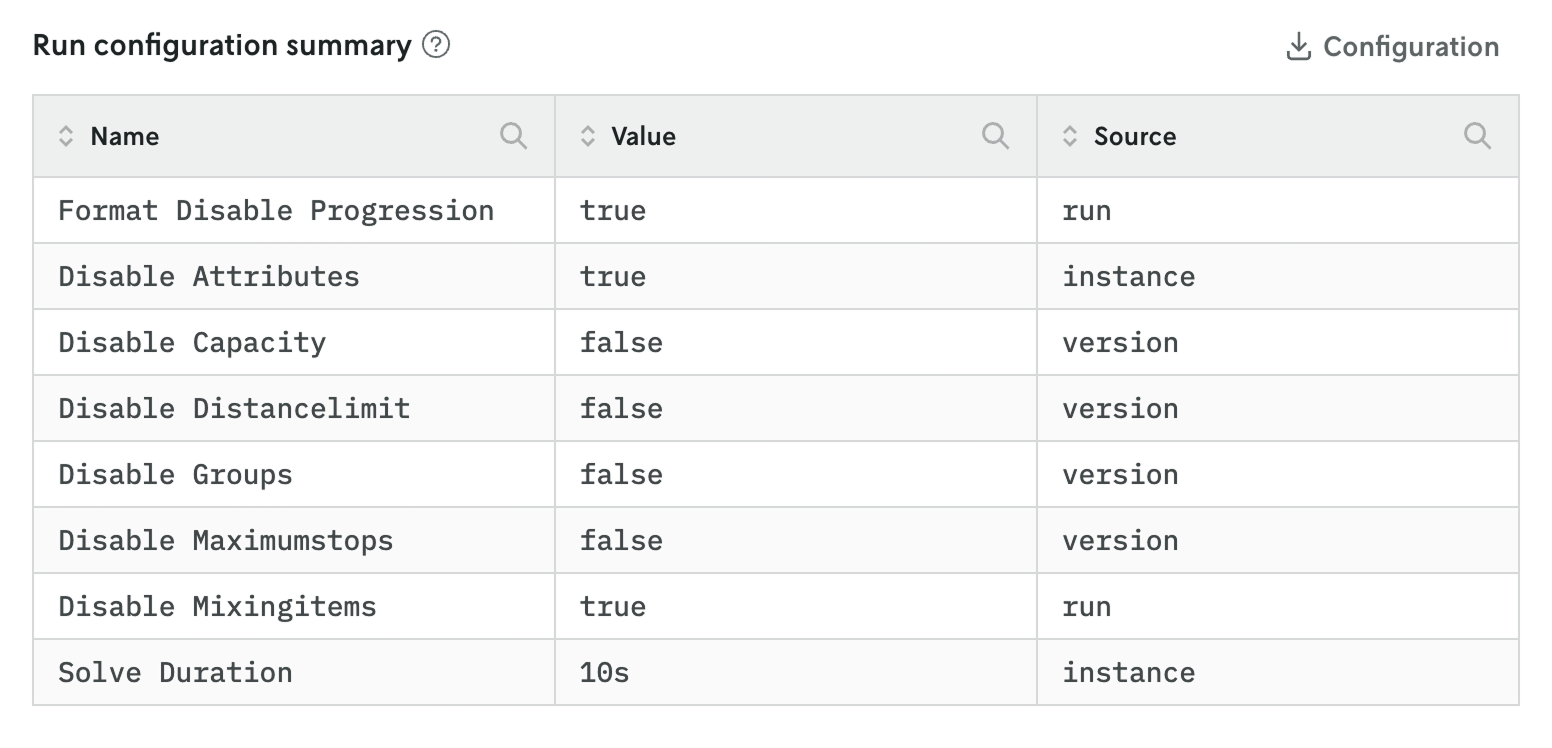
A new table is available on the run summary view that shows which options were applied to the run and where in the hierarchy they were applied.
If an option was applied by the version (that is, an defined option default value), the source is marked as version. If an option was applied at the instance level (an override of a version’s default value), the source is marked as instance. If an option value was overridden for the specific run, the source is marked as run.
v1.12.2
October 2, 2025What's Changed
Full Changelog: v1.12.1...v1.12.2
v1.12.1
October 2, 2025What's Changed
- Improve Solution struct by @dirkschumacher in #103
- Improve maximum objective value performance by @dirkschumacher in #106
- Update go in github actions to 1.25 by @dirkschumacher in #112
- Add epsilon comparison for maximum constraint by @TheMarex in #107
New Contributors
Full Changelog: v1.12.0...v1.12.1
Run queuing
October 2, 2025
You now have the ability to set the queue priority for runs in Nextmv Console. You can set the queue priority (or disable it) on an instance or on a specific run. And you can override an instance’s default queue priority setting on a indiviudal run as well.
Read more about run queuing and prioritization in the Docs.

Tabbed view sharing for scenario tests
October 2, 2025
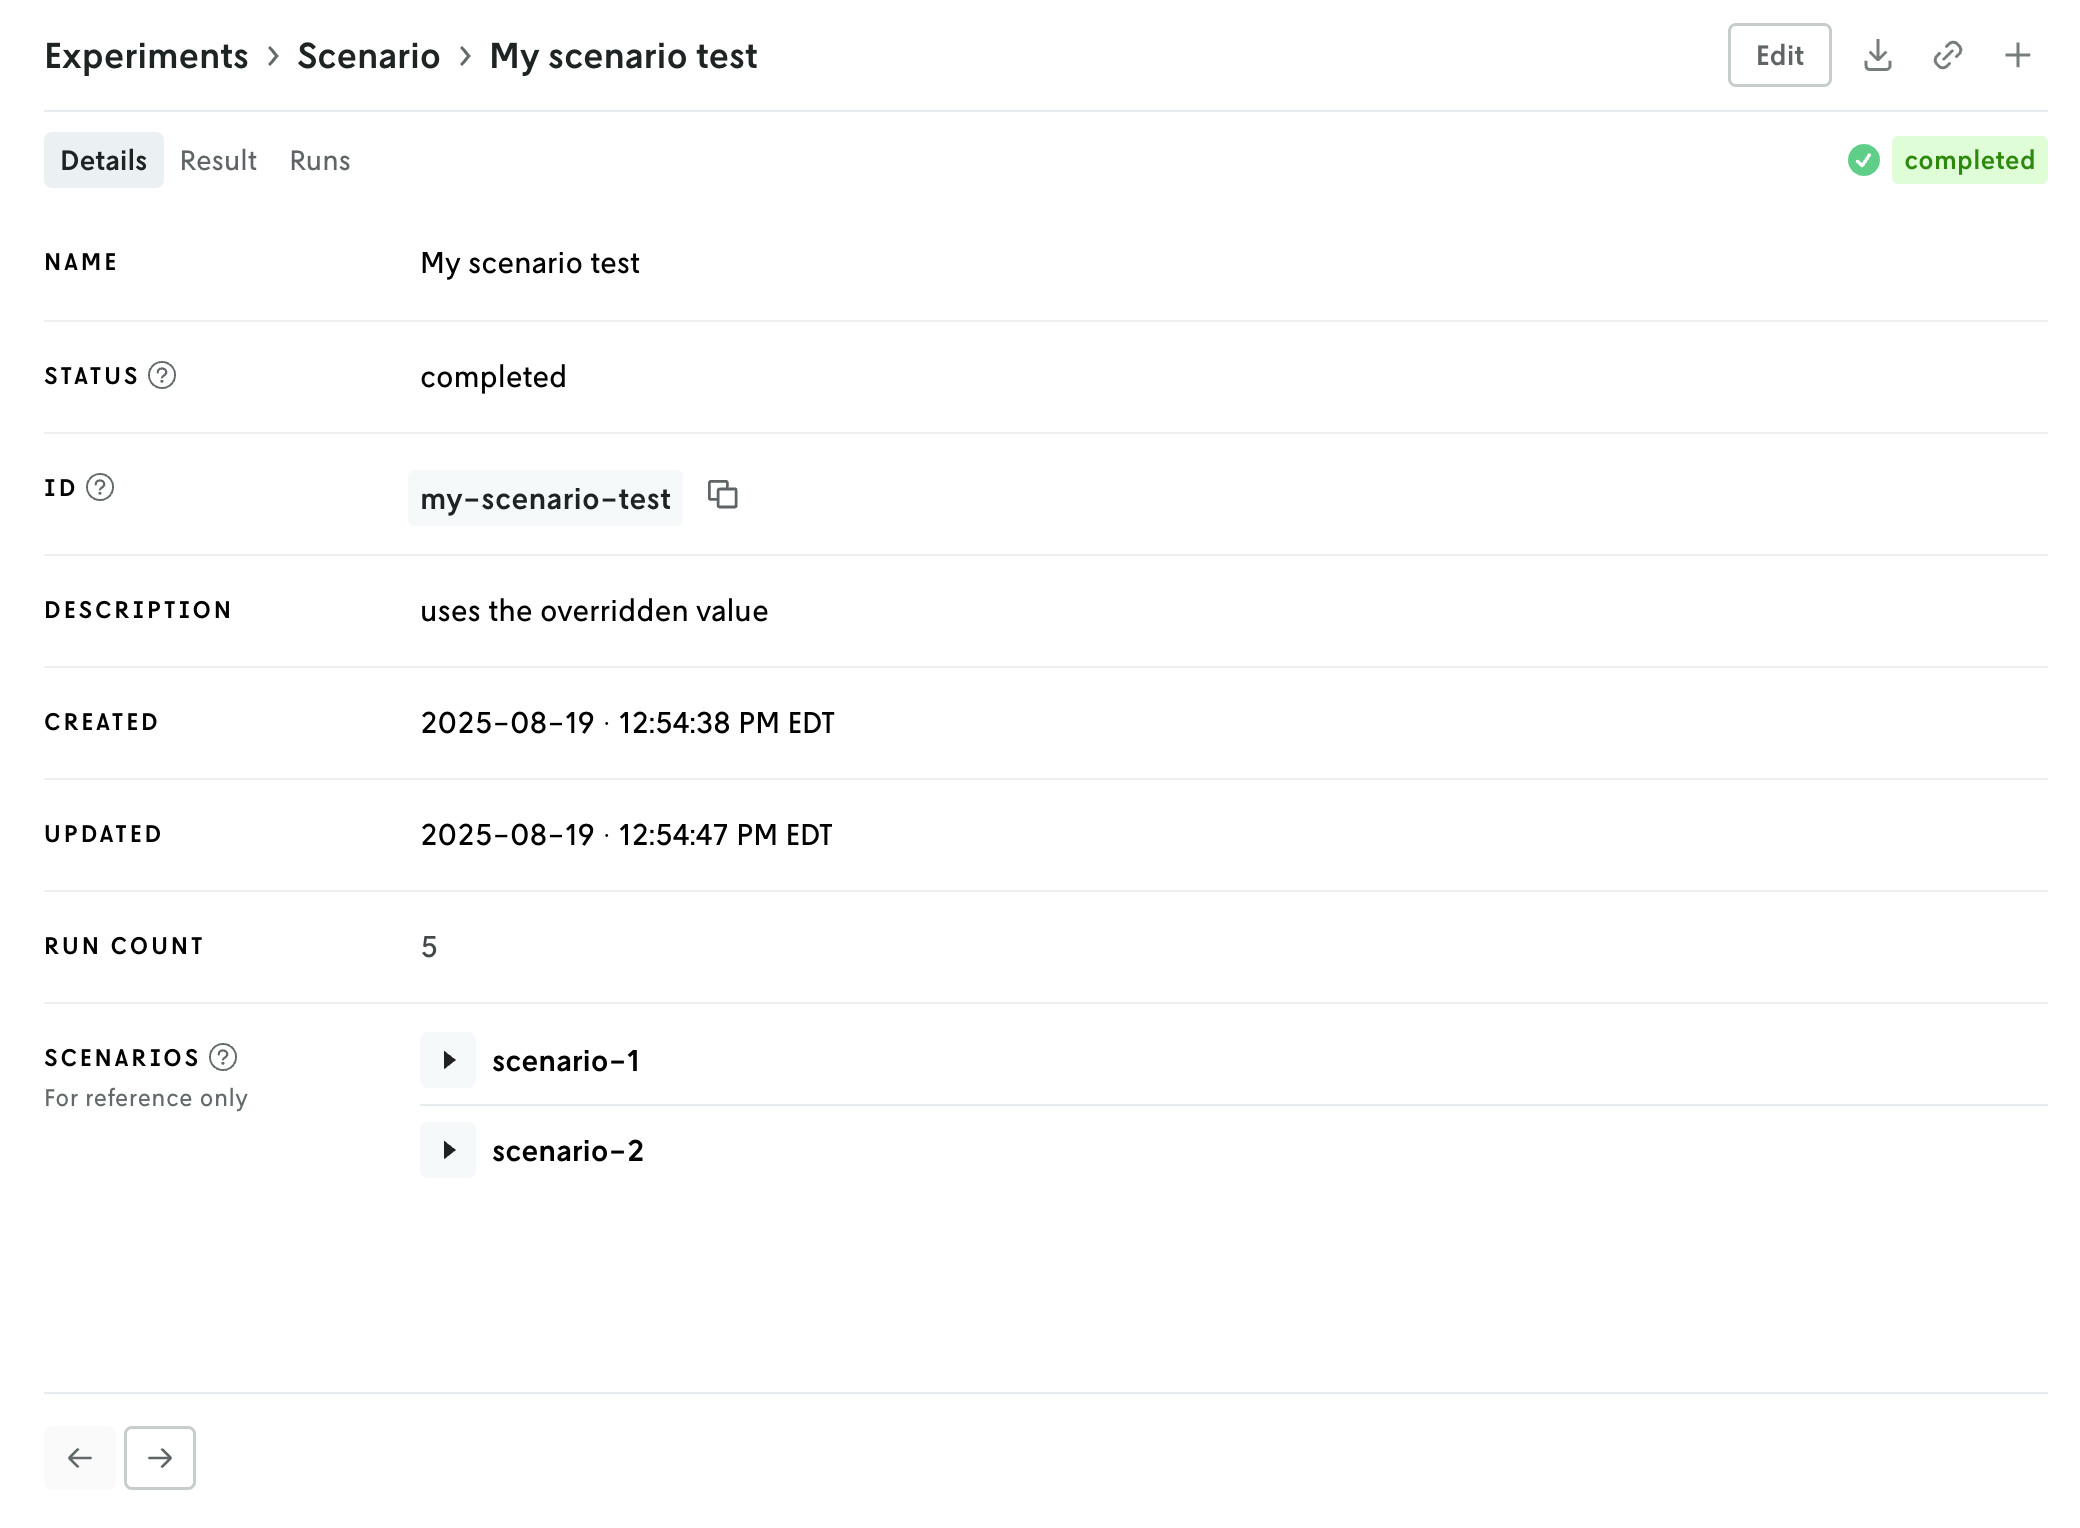
Scenario tests now have a tabbed interface for the details view that separates the result, runs, and test details. This separates the test results for easier viewing and allows you to share a specific view (e.g. the test result) with others via the share button in the header (or copying the URL directly).
Managed Latest instance
October 1, 2025
A new managed instance called Latest has been added to the Nextmv Platform. Now, when you push a new model to an app, a new instance will be created named Latest with an ID of latest. If the managed Latest instance already exists, the newly pushed binary will be assigned to the managed Latest instance.
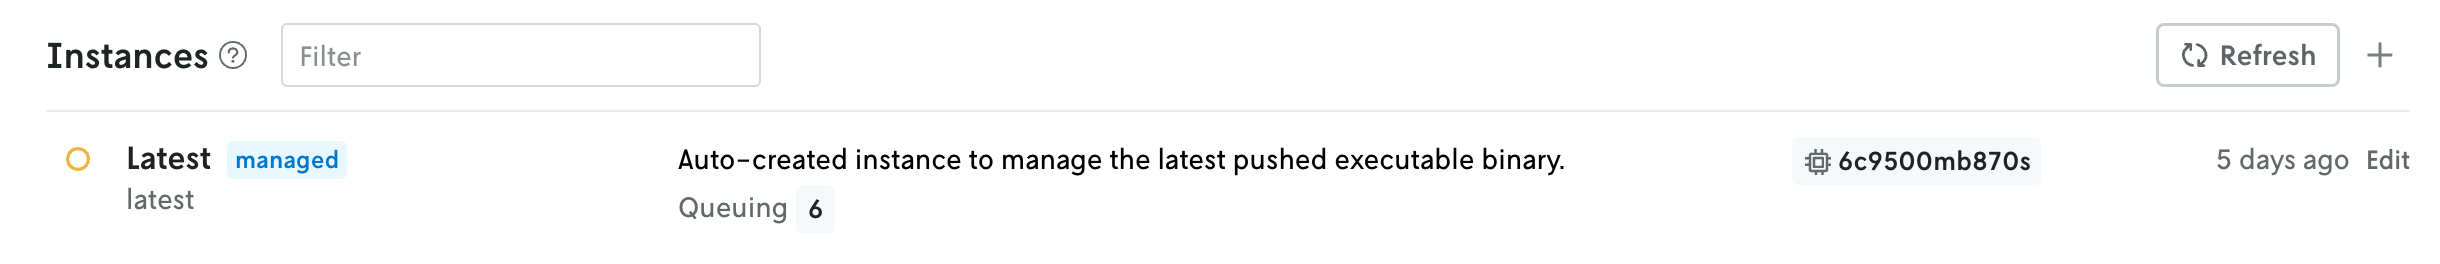
This new managed Latest instance will always have the most recently pushed binary for an app. Functionally, it is equivalent to the existing managed devint instance, but is a more user-friendly entity to interact with in Nextmv Console, especially for non-devs.
You can read more about the new managed Latest instance in the Docs.
Email invites
October 1, 2025
When you add a new person to your team, in addition to the invite notification that appears in their account when they login, an invite email is now sent as well. This invite email includes a link to view the invite in Nextmv Console. If the person is already authenticated it will go directly to the invites page where they can accept the invite.
If they are not authenticated, after logging in they will be redirected to the invites page; and if they do not have an account yet, after signing up for a new account they will be directed to the invites page on sign in where they can accept the invite.
nextmv-v0.31.0
September 25, 2025What's Changed
- 5/6: Changes local namespace so that local experience lives under
localby @sebastian-quintero in #137 - 4/6: Adds visualization features to local experience by @sebastian-quintero in #135
- 3/6: Methods for syncing local runs to Cloud by @sebastian-quintero in #134
- 2/6: Methods for getting local results by @sebastian-quintero in #133
- Add
formatfield toMetadataby @cnpryer in #141 - The Python SDK community edition by @sebastian-quintero in #132
- Release v0.31.0 by @sebastian-quintero in #142
nextmv-v0.30.0
September 21, 2025What's Changed
- Fixes acceptance tests by @merschformann in #136
- Adds batch experiment & scenario test polling by @sebastian-quintero in #139
- Adds content configuration via manifest by @merschformann in #138
- Release v0.30.0 by @sebastian-quintero in #140
v1.12.0
September 19, 2025What's Changed
- Migrates go linter to v2 by @merschformann in #90
- Fixes the auto benchmark workflow by @merschformann in #99
- Fixes 0 iteration limit waiting indefinitely by @merschformann in #95
- Improve multi stop plan unit generation by @dirkschumacher in #39
- Adds distance objective, supports objective vehicle data by @merschformann in #96
Full Changelog: v1.11.4...v1.12.0
v0.3.5
August 27, 2025What's Changed
- Uses platform defined default instance by @merschformann in #32
- Release v0.3.5 by @merschformann in #33
Full Changelog: v0.3.4...v0.3.5
nextmv-v0.29.4
August 26, 2025What's Changed
- Fixes example for new_secrets_collection by @merschformann in #120
- Refactor batch exp creation with instance ids by @sebastian-quintero in #121
- Un-deprecate the use of instance-ids for batch experiments by @sebastian-quintero in #122
- Introduce application initialization by @sebastian-quintero in #123
- Aligns default instance behavior around new 'latest' convention by @merschformann in #125
- Release v0.29.4 by @merschformann in #126
v0.3.4
August 4, 2025What's Changed
- Removes artificial sub-run bottleneck by @merschformann in #29
- Bumps version to v0.3.4 by @merschformann in #30
Full Changelog: v0.3.3...v0.3.4
v0.3.3
August 4, 2025What's Changed
- Fix workflow to allow pre-release no push by @sebastian-quintero in #27
- Exposes configuration by @merschformann in #28
Full Changelog: v0.3.2...v0.3.3