Batch experiments are used to analyze the output from one or more decision models on a fixed input set. They are generally used as an exploratory test to understand the impacts to business metrics (or KPIs) when updating a model with a new feature, such as an additional constraint. They can also be used to validate that a model is ready for further testing and likely to make an intended business impact.
To be concise, batch experiments take the inputs from the input set and the specified instances and do a run for each input-instance pair. The results are then aggregated and analyzed. The decision model must produce an output that contains a statistics block that uses the statistics convention.
When working with scenario tests, you can configure two or more scenarios, all with the same input set but with different instances. This achieves the same goal as a batch experiment. The main difference is that scenario tests are more flexible and provide more detailed results.
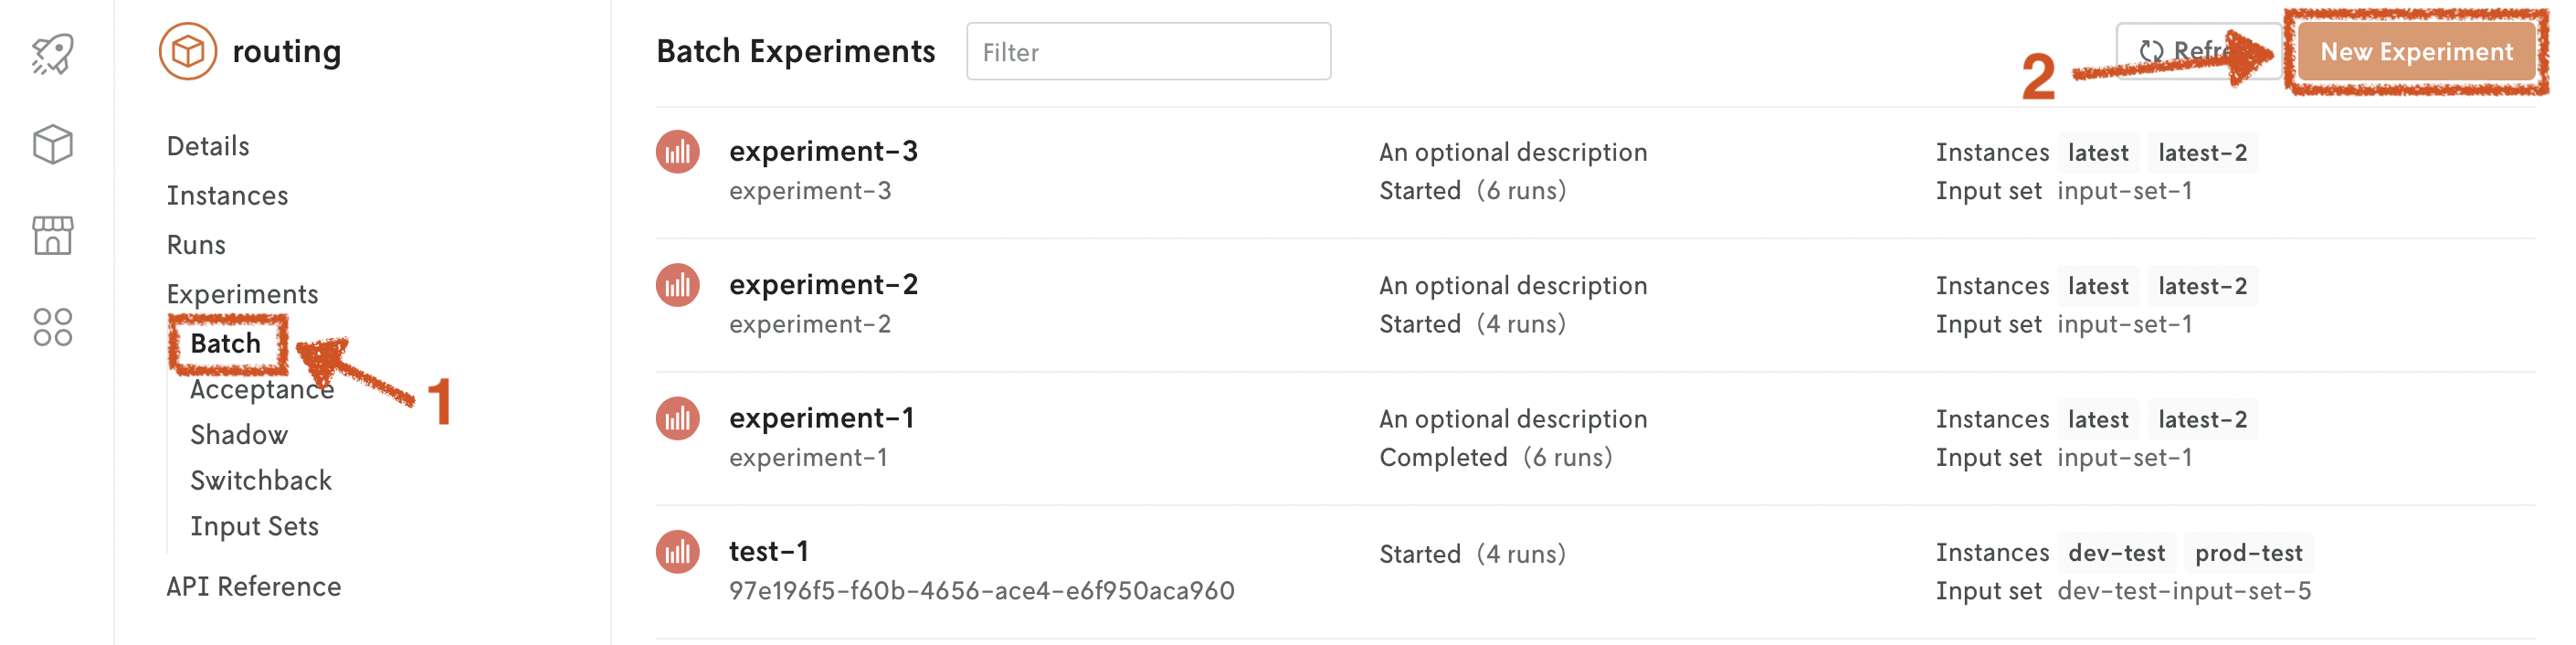
Batch experiments are designed to be visualized in the Console web interface. Go to the app, Experiments > Batch tab.
A batch experiment needs an input set to run.
There are several interfaces for creating batch experiments:
- Console: use the web interface.
- Nextmv CLI: use your terminal.
- Python SDK: use Python.
- Cloud API: use the HTTP endpoints.
In addition to an input_set_id and instance_ids, a batch experiment can process runs and option_sets.
runs. A list of objects.Without
runs, the batch experiment will run all of the inputs in the input set on all of the instances. Withruns, the batch experiment will only run the specified inputs on the specified instances. Theinput_idof a run can be either a previousrun_idor a managedinput_id. Therunslist can also be used to run the same input multiple times on specific instances or versions.A run can specify an
option_setto be used for that run.option_sets. A dictionary of objects.option_setsis a dictionary of options that will be used for a run. An option set can be referenced in therunslist via itsoption_set_id. This can be useful for example if:- You want to compare the results of different solvers that have conflicting options. E.g. one uses
solve.durationfor the maximum runtime while the other usesduration. - You want to run specific inputs with different options within the same experiment.
- You want to compare the results of different solvers that have conflicting options. E.g. one uses
Console
Go to the Console web interface, and open your app. Go to the Experiments > Batch tab. Click on New Experiment. Fill in the fields.
Nextmv CLI
Define the desired batch experiment ID and name. After, create the batch experiment.
Alternatively, you can use a JSON file that contains all of the information needed to start a batch experiment. The file must be valid JSON and equal to the payload of the POST request when using the Cloud API.
Using the definitions file you can fine tune the batch experiment by specifying runs and option_sets, for example.
Consider this example using a JSON file named batch-experiment.json.
Cloud API
Create and start batch experiment.
Create and start batch experiment.
Define the desired batch experiment ID and name. After, create the batch experiment.
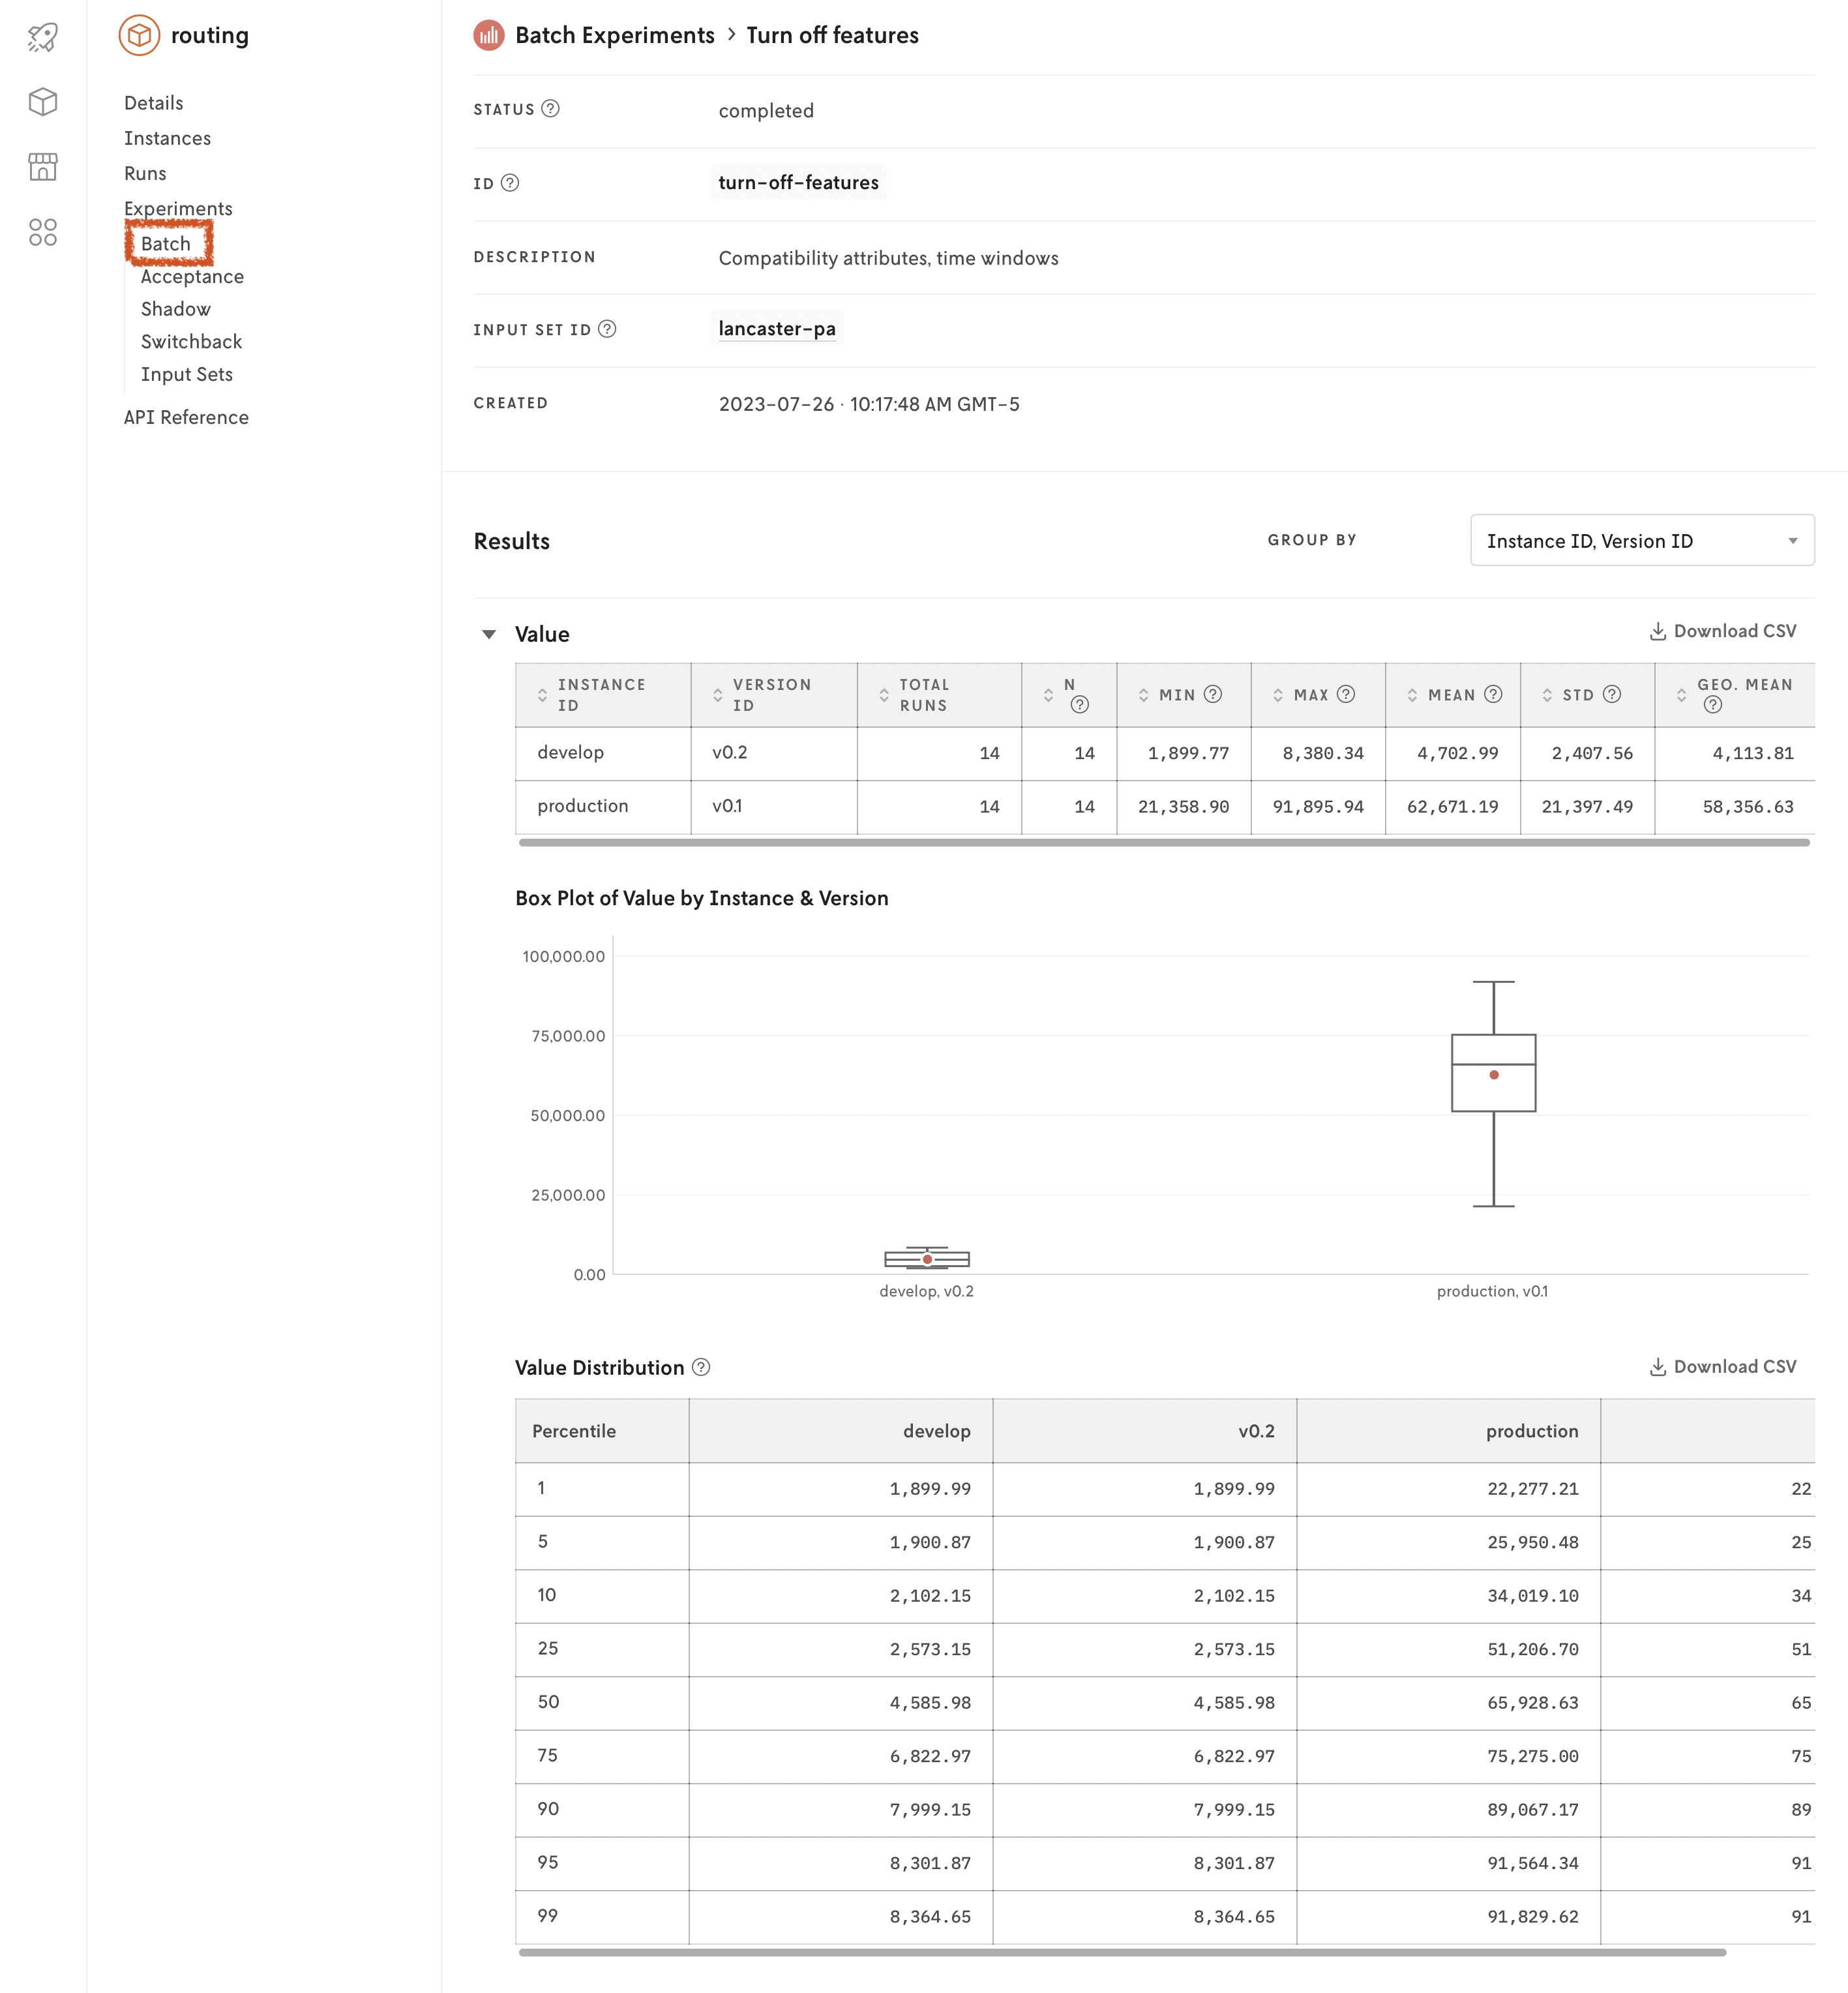
Result of a batch experiment - Console
Nextmv Console displays the results grouped by indicator keys and for each one includes:
- a summary table
- the percentile values
- a box plot chart displaying summary values from the instances compared
Result of a batch experiment - CLI
The results can also be retrieved with the Nextmv CLI, which returns the raw data in JSON format and is useful if you would like to perform your own operations on the experiment results.
The result of a batch experiment is returned as JSON. If you’re viewing the result in Console, the JSON is parsed and displayed in a web view; Nextmv CLI returns the complete JSON response. The response contains the batch experiment metadata and the results in the form of grouped distributional summaries.
Top-level properties
The table below summarizes the top-level properties in the return.
| Field | Description |
|---|---|
id | The batch experiment ID that was specified. |
name | The batch experiment name that was specified. |
description | The batch experiment description that was specified. If no description was specified this field will not exist. |
status | The status of the experiment. The status can be: started, completed, or failed. |
created_at | The date the experiment was created and started. |
input_set_id | The input set ID specified for the batch experiment. |
instance_ids | An array of the Instance IDs that were specified for the batch experiment. |
grouped_distributional_summaries | The grouped distributional summaries is an array that contains the results of the batch experiment. It is a collection of calculated results from the individual runs by certain groupings. |
Grouped distributional summaries
There are three types of summaries included in the grouped_distributional_summaries array (there could be more in the future):
- Version (instance)
- Version (instance) + input
- Input
Each type is included for every experiment. However, note that if you are viewing the experiment in Console, ONLY the version summaries are displayed. In the future, Console will display all types of summaries.
No matter the type, each grouped distributional summary includes the following:
| Field | Description |
|---|---|
group_keys | This describes the type of group distributional summary which can be one of three options:
|
group_values | The values that correspond to the group_keys. So if the group keys are instanceID and versionID, the group_values will be the ID of the instance and the ID of the version. |
| These are the statistics that are being evaluated by the batch experiment. If you’re using the
Custom statistics can be specified by adding them to the output JSON’s top-level |
indicator_distributions | An object that contains all of the values from the analysis for that particular indicator. If there are six indicator keys for example, the indicator_distributions will contain six object properties, the property key will correspond to the values in the indicator_keys array and each property value will be an object with matching data (see Indicator distributions section below). |
number_of_runs_total | This is the number of runs that were analyzed for this particular summary. For example, if you ran an experiment with two instances and an input set with three runs, the version summary (instanceID + versionID) will have a run total of three runs because it is running all three input files on that particular version. The version & input summary (instanceID + versionID + inputID) will have one run because it ran that one input file on that particular version. And the input summary (inputID) will have two runs because it ran that input file on the two instances. |
Indicator distributions
Each object property value in the indicator_distributions contains the values in the table below. Note that for some runs, certain values may be missing (a custom statistic for example). If you’re viewing the results in Console and a grouped distributional summary is missing values, a warning message will appear. If you are analyzing the results from the returned JSON, you must handle this check in your own systems.
When the runs are being evaluated, the final value is taken from the last solution found before the run has been terminated. The run duration can be set as an option on the experiment or will be set by the executable binary used for the run.
All values in the indicator distributions are either numbers or strings. If they are strings, they are one of three string values: nan, +inf, or -inf.
| Field | Description |
|---|---|
min | The minimum of the values returned from the runs for the statistic being evaluated. For example, if you are viewing the result.custom.used_vehicles indicator distribution, and if there were three runs with one input file returning 50, another 40, and the other 60; the min value would be 40. |
max | The maximum of the values returned from the runs for the statistic being evaluated. |
count | The number of successful runs that have the specific indicator in their statistics output. |
mean | The average of the values returned from the runs for the statistic being evaluated. |
std | The standard deviation of the values returned from the runs for the statistic being evaluated. Uses a denominator of n−1 (see Corrected sample standard deviation). |
shifted_geometric_mean | The shifted geometric mean of the values returned from the runs for the statistic being evaluated. (The shift parameter is equal to 10.) |
percentiles | An object that contains the percentiles of the values returned from the runs for the statistic being evaluated. There are nine values that give the following percentiles: 1%, 5%, 10%, 25%, 50%, 75%, 90%, 95%, and 99%. |
Experiment runs
Runs made for the experiment can be retreived with this endpoint.
List batch experiment runs.
List runs used for batch experiment specified by application and batch ID.
This will return the runs of the experiment in the following format:
Where runs is an array that contains the runs made for the experiment. Each run object includes the run metadata plus any summary statistics that were specified in the excecutable binaries used for the experiment (see table below).
Experiment runs must be retrieved independent of the batch experiment details. However, in Console this run history table can be viewed at the bottom of the experiment details. Each run history item can be clicked to view the details of the run. If the app is a routing app (using either the routing or nextroute template) the run details will also include a visualization of the results.
The run history data can also can be downloaded as a CSV file in Console. Click the Download CSV link in the upper right area of the experiment run history table to download the data as a CSV file.
Note that experiment runs are not shown in your app’s run history.
Experiment run summary data
Run history objects can include the items specified in the table below.
| Field | Description |
|---|---|
id | The id for the run. This is generated automatically and cannot be changed. |
created_at | The date and time the run was created. |
application_id | The ID of the application in which the run was made. |
application_instance_id | The ID of the instance used for the run. |
application_version_id | The ID of the version used for the run. |
experiment_id | The ID of the experiment for which the run was made. |
input_id | The ID of the input used for the run. |
status | The status of the run. This can be either running, succeeded, or failed. If the status if failed, no error will be shown in the run history data, but the details of this run will contain relevant error messages. The run details for an experiment run can be viewed in Console by clicking on the run ID in the experiment run history table or retrieved using the /applications/{application_id}/runs/{run_id} endpoint. |
| The statistics evaluated for the experiment and their values. The
The status of the statistics can be The In Console, the indicator values are shown in the experiment run history table only if they are present. No errors are displayed. |
Delete a batch experiment
Deleting a batch experiment will also delete all of the associated information such as the udnerlying app runs.
This action is permanent and cannot be undone.
To delete a batch experiment, you can use the following interfaces:
Console: use the web interface. Use the
Deletebutton in the batch experiment details.Nextmv CLI: use your terminal.
The command will prompt you to confirm the deletion. Use the
--confirmflag to skip the confirmation.Cloud API: use this HTTP endpoint.
DELETEhttps://api.cloud.nextmv.io/v1/applications/{application_id}/experiments/batch/{batch_id}Delete a batch experiment.
Delete a batch experiment specified by application and batch ID.
You will not be prompted to confirm the deletion.