Acceptance tests
Learn how to run acceptance tests with your tool of choice.
- CLI: the Nextmv Command Line Interface (CLI).
- Python SDK: a Software Development Kit (SDK) for Python developers.
- Cloud API: an HTTP API for developers to integrate with the Nextmv platform.
Acceptance tests are formal tests that verify if a system satisfies business requirements. In an optimization context, an acceptance test determines if business goals or key performance indicators (KPIs) are met by a new model (typically on a set of inputs always used for testing) and allow you to determine whether or not to deploy a model update to production.
When an acceptance test is run, data is collected from runs made with the
baseline and candidate instances, and then the candidate
instance's metrics are compared to the baseline instance’s metrics. The result
of these comparisons is determined by the operator for how the metric should
be evaluated. For example, if should increase is set for a metric, it means
that the value of the metric in the output returned for the candidate instance
should be greater than the same metric value returned from the baseline
instance.
To be concise, an acceptance test is based on a batch
experiment. For the metrics specified in the acceptance
test, it compares the results of two instances: candidate vs
baseline. For each metric (comparison), the acceptance test gives a pass/fail
result based on the operator. An acceptance test can be thought of a view on
a batch experiment, with a focus on the metrics.
Warning
When using subscription apps, make sure the candidate and
baseline instances do not use a major version,
i.e.: v1 or v2. Instead, assign a complete (specific) version to your
instances, i.e.: v1.1.0.
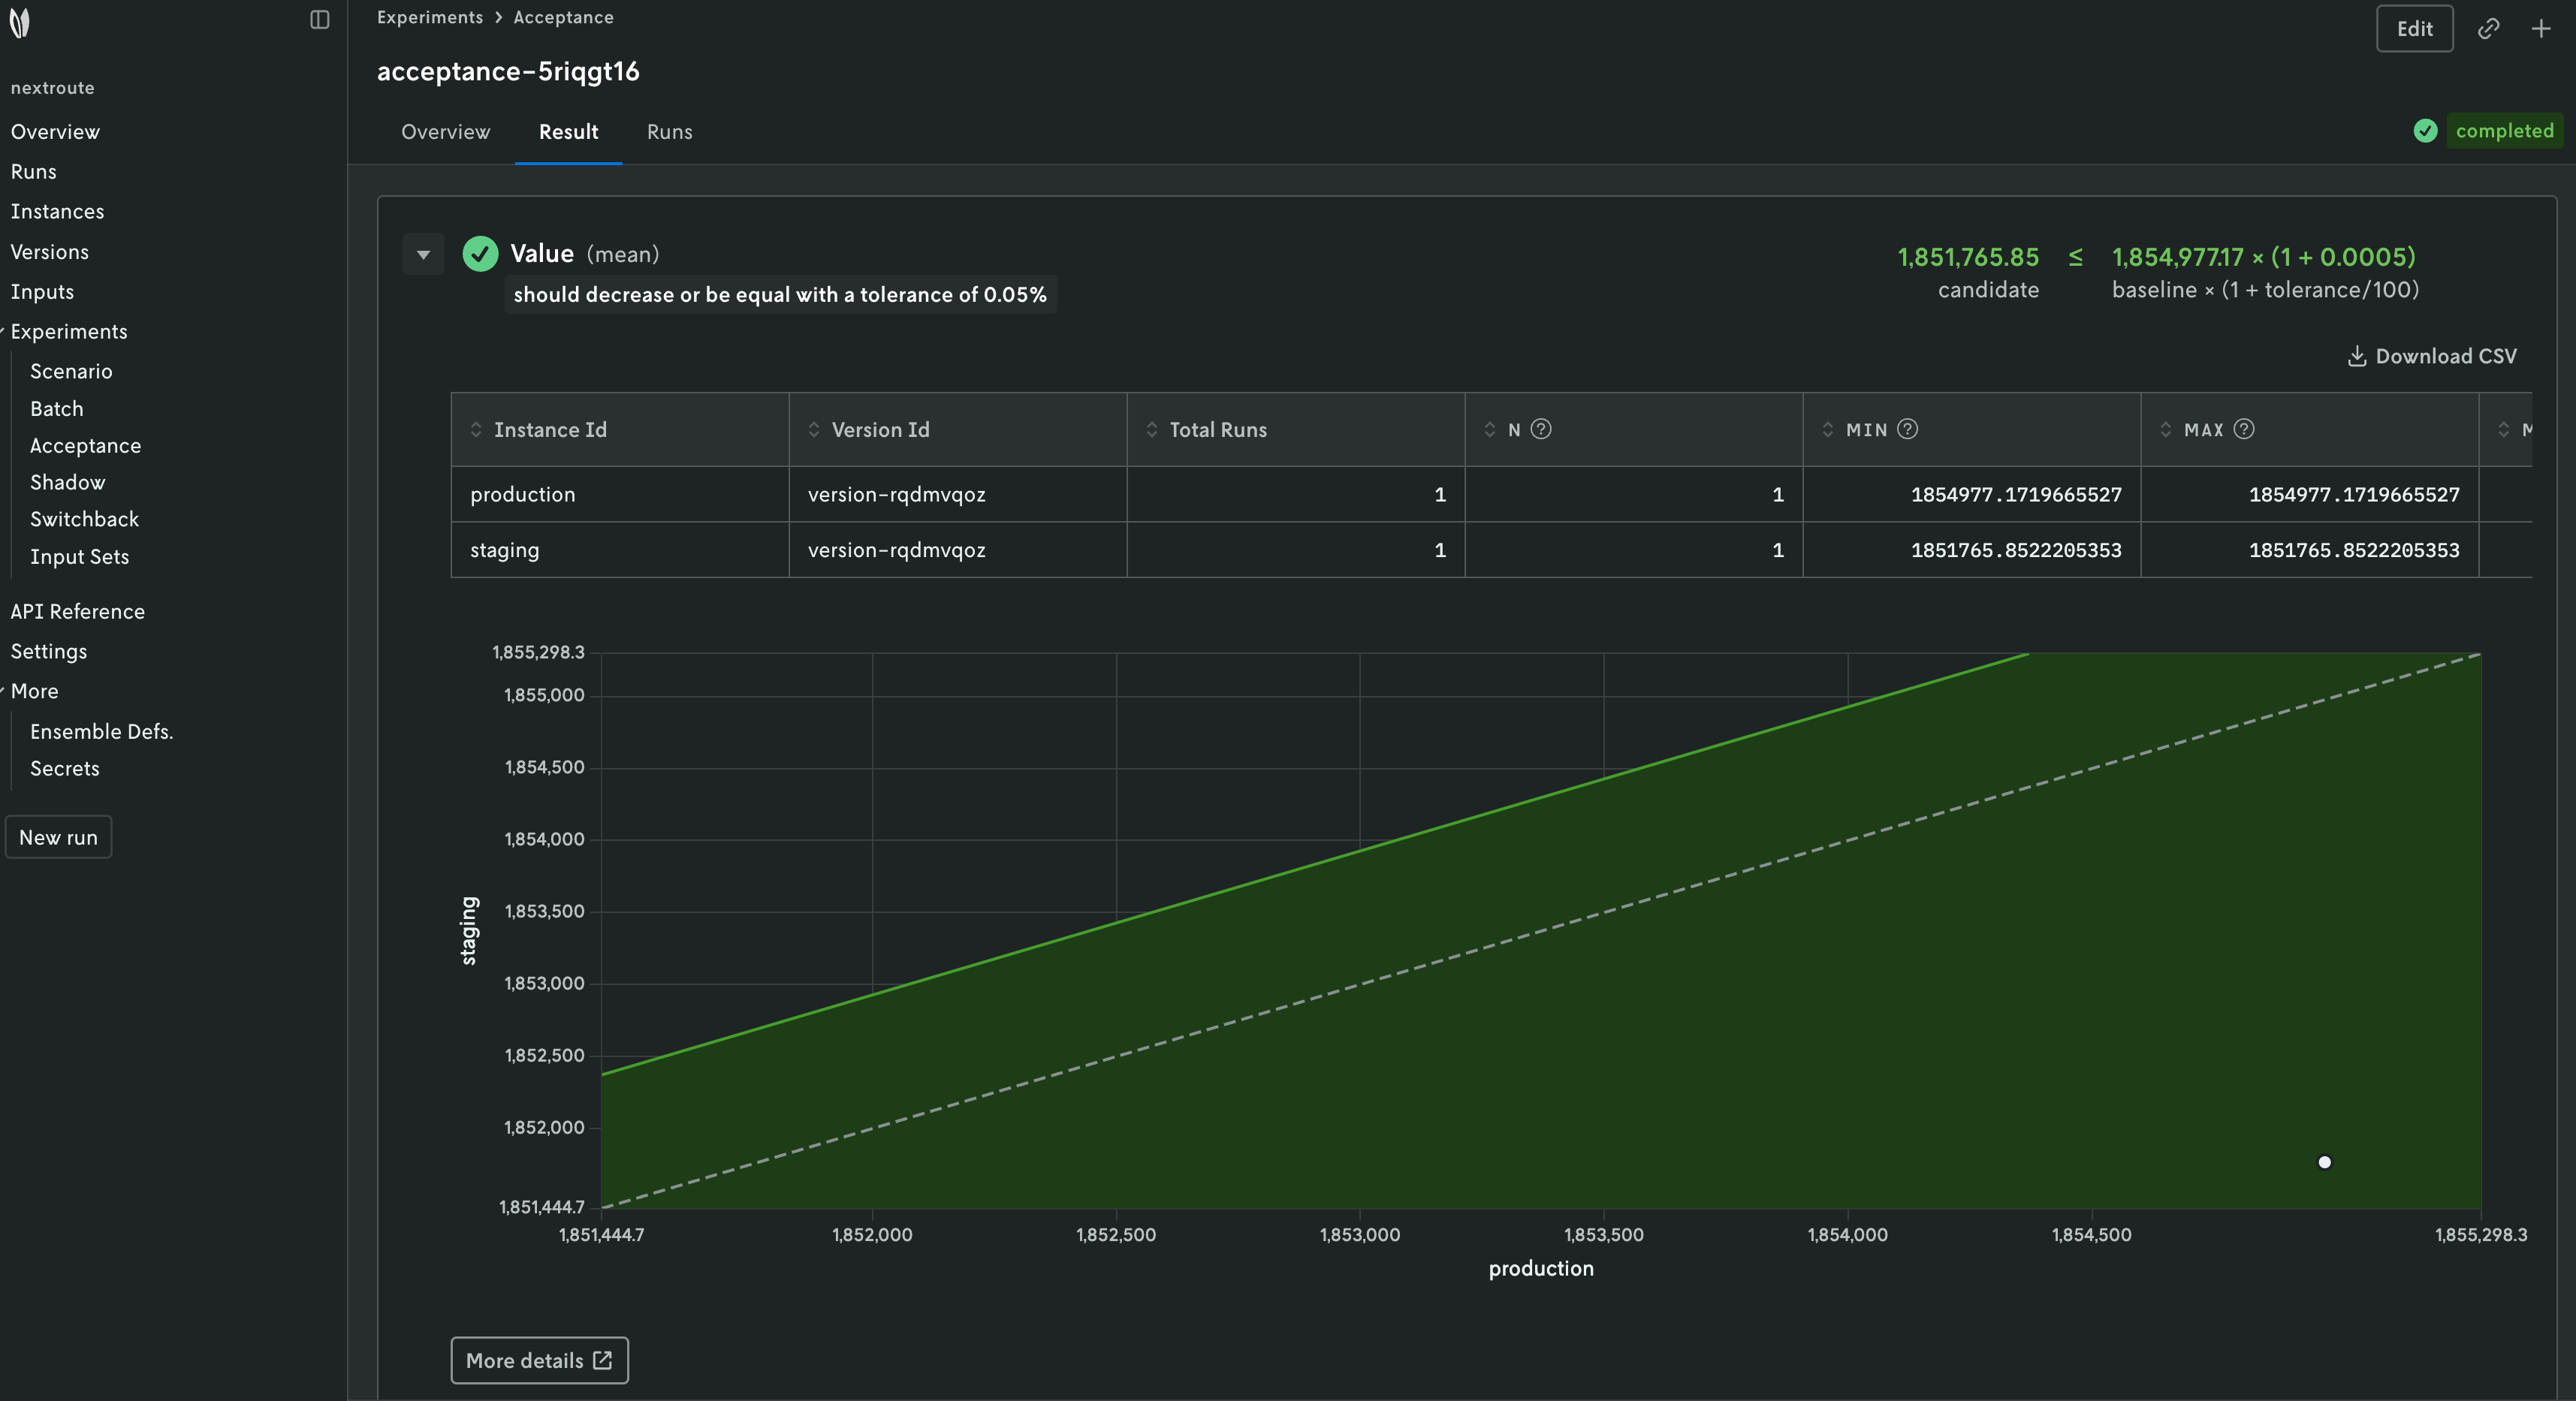
Acceptance tests are designed to be visualized in the Nextmv
Console. Go to the app, Experiments > Acceptance tab.
Defining metrics
When you are creating an acceptance test you must define the metrics you want to analyze. At least one metric is required to run an acceptance test. These metrics are user-defined, though if you are using a subscription app or a custom app based on a community app, there are some pre-defined metrics available to you.
The metrics are governed by the metrics convention. Any item under
metrics is a valid entry for an acceptance test metric. To specify a metric,
use object dot notation for path reference, starting from the .metrics field
of the output. The metric is specified relative to the parent metrics
block.
To compare metrics, you must define the operator for the comparison.
| Operator | Symbol | Description |
|---|---|---|
eq |
== |
Equal to |
gt |
> |
Greater than |
ge |
>= |
Greater than or equal to |
lt |
< |
Less than |
le |
<= |
Less than or equal to |
ne |
!= |
Not equal to |
Consider the following example.
{
  "options": {
    "duration": 30
  },
  "solution": {
    "items": [
      {
        "id": "cat",
        "value": 100,
        "weight": 20
      },
      {
        "id": "water",
        "value": 40,
        "weight": 2
      },
      {
        "id": "phone",
        "value": 6,
        "weight": 1
      },
      {
        "id": "book",
        "value": 63,
        "weight": 10
      },
      {
        "id": "rx",
        "value": 81,
        "weight": 1
      },
      {
        "id": "coat",
        "value": 44,
        "weight": 9
      },
      {
        "id": "keys",
        "value": 92,
        "weight": 1
      },
      {
        "id": "nuts",
        "value": 18,
        "weight": 4
      }
    ]
  },
  "assets": [],
  "metrics": {
    "duration": 0.0011775493621826172,
    "value": 444,
    "status": "HighsStatus.kOk",
    "variables": 11,
    "constraints": 1,
    "solver_version": "1.9.0"
  }
}
These are valid metrics for the acceptance test:
durationwithge: the run duration of the candidate must be greter than or equal to the baseline.valuewithle: the value of the result in the candidate must be less than or equal to the baseline.variableswitheq: the number of variables in the candidate must be equal to the baseline.constraintswitheq: the number of constraints in the candidate must be equal to the baseline.
Results
Also included is a Statistical Results table that can be used as an aid when interpreting the significance of the results. It includes the difference between the mean value of the metric for the candidate and the baseline instance, the percentage change of that difference, and the associated p-value.
The p-value is calculated with the Wilcoxon signed rank test with continuity correction. This value gives an indication of whether the change in value is statistically significant, but does not account for the intended direction of the test. If there is no difference in the data, the p-value is not provided.
Note that in cases where one of the runs from either the candidate or baseline instances failed, the paired observation for this input will be excluded from analysis.