Chart.js
Chart.js is a widely-used JavaScript library for creating
modern charts for the web. It’s highly flexible and performant and can be used
to create multiple types of charts. When you use the Chart.js custom visual
type, your data is rendered using Chart.js’s Chart class.
To view a quick demo of the custom Chart.js visual, use the example echo
app to run the input below.
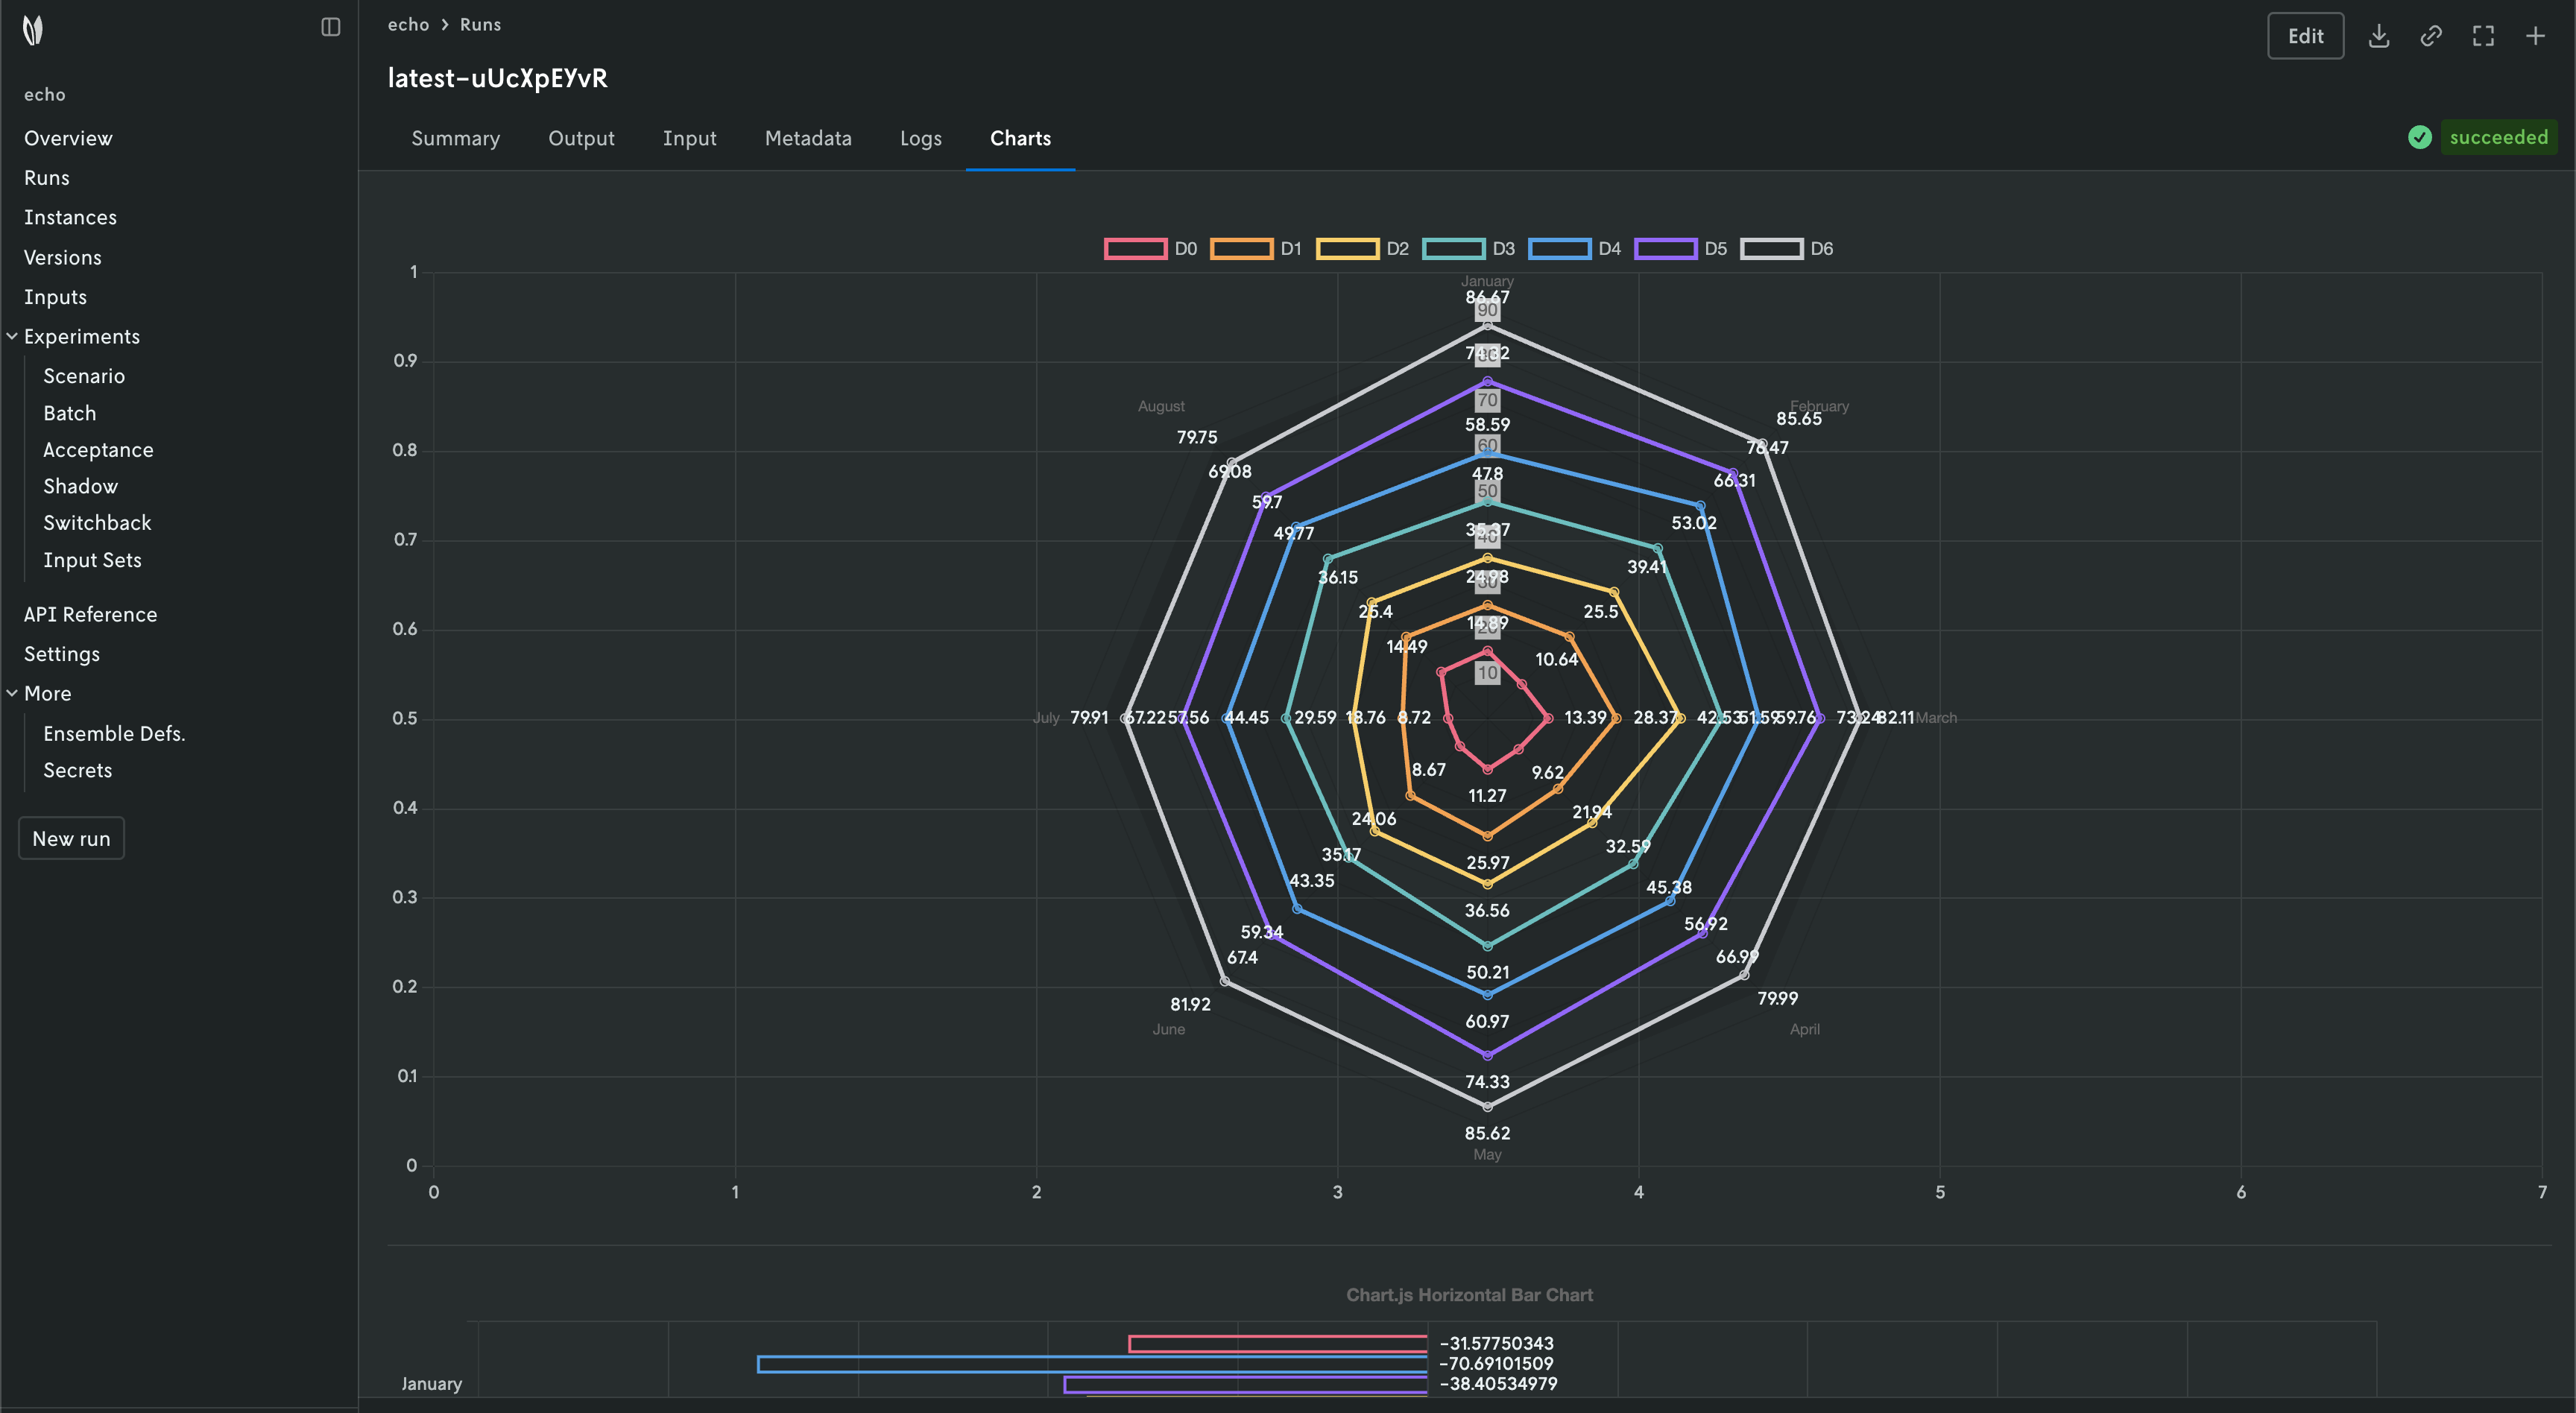
{
  "assets": [
    {
      "name": "Chart.js example",
      "content_type": "json",
      "visual": {
        "schema": "chartjs",
        "type": "custom-tab",
        "label": "Charts"
      },
      "content": [
        {
          "type": "radar",
          "data": {
            "labels": [
              "January",
              "February",
              "March",
              "April",
              "May",
              "June",
              "July",
              "August"
            ],
            "datasets": [
              {
                "label": "D0",
                "data": [14.89, 10.64, 13.39, 9.62, 11.27, 8.67, 8.72, 14.49],
                "borderColor": "rgb(255, 99, 132)"
              },
              {
                "label": "D1",
                "data": [24.98, 25.5, 28.37, 21.94, 25.97, 24.06, 18.76, 25.4],
                "borderColor": "rgb(255, 159, 64)",
                "fill": "-1"
              },
              {
                "label": "D2",
                "data": [35.37, 39.41, 42.53, 32.59, 36.56, 35.17, 29.59, 36.15],
                "borderColor": "rgb(255, 205, 86)",
                "fill": 1
              },
              {
                "label": "D3",
                "data": [47.8, 53.02, 51.59, 45.38, 50.21, 43.35, 44.45, 49.77],
                "borderColor": "rgb(75, 192, 192)",
                "fill": false
              },
              {
                "label": "D4",
                "data": [58.59, 66.31, 59.76, 56.92, 60.97, 59.34, 57.56, 59.7],
                "borderColor": "rgb(54, 162, 235)",
                "fill": "-1"
              },
              {
                "label": "D5",
                "data": [74.32, 76.47, 73.24, 66.99, 74.33, 67.4, 67.22, 69.08],
                "borderColor": "rgb(153, 102, 255)",
                "fill": "-1"
              },
              {
                "label": "D6",
                "data": [86.67, 85.65, 82.11, 79.99, 85.62, 81.92, 79.91, 79.75],
                "borderColor": "rgb(201, 203, 207)",
                "fill": { "value": 85 }
              }
            ]
          }
        },
        {
          "type": "bar",
          "data": {
            "labels": [
              "January",
              "February",
              "March",
              "April",
              "May",
              "June",
              "July"
            ],
            "datasets": [
              {
                "label": "Dataset 1",
                "data": [
                  -31.57750343, 97.13820302, -11.38888889, 97.1622085,
                  69.70507545, -98.69855967, 24.05006859
                ],
                "borderColor": "rgb(255, 99, 132)"
              },
              {
                "label": "Dataset 2",
                "data": [
                  -70.69101509, -76.74897119, 15.75274348, -57.38340192,
                  -78.87345679, -61.06310014, -23.70541838
                ],
                "borderColor": "rgb(54, 162, 235)"
              },
              {
                "label": "Dataset 3",
                "data": [
                  -38.40534979, 60.26920439, 97.00960219, -88.67798354,
                  46.41632373, -28.57167353, 36.97530864
                ],
                "borderColor": "rgb(153, 102, 255)"
              },
              {
                "label": "Dataset 4",
                "data": [
                  -35.95507545, 66.21742112, 5.22119342, 79.82167353,
                  48.04355281, 82.72633745, 60.41323731
                ],
                "borderColor": "rgb(255, 205, 86)"
              },
              {
                "label": "Dataset 5",
                "data": [
                  -16.4266118, -63.84259259, -27.51371742, -60.52640604,
                  32.18106996, 82.70747599, -17.58916324
                ],
                "borderColor": "rgb(75, 192, 192)"
              }
            ]
          },
          "options": {
            "indexAxis": "y",
            "elements": { "bar": { "borderWidth": 2 } },
            "responsive": true,
            "plugins": {
              "legend": { "position": "right" },
              "title": {
                "display": true,
                "text": "Chart.js Horizontal Bar Chart"
              }
            }
          }
        },
        {
          "type": "line",
          "data": {
            "labels": [
              "January",
              "February",
              "March",
              "April",
              "May",
              "June",
              "July"
            ],
            "datasets": [
              {
                "label": "Dataset 1",
                "data": [
                  -46.718107, 64.3021262, -79.20438957, 6.71296296,
                  -23.62482853, 76.69581619, -97.26337449
                ],
                "borderColor": "rgb(255, 99, 132)",
                "yAxisID": "y"
              },
              {
                "label": "Dataset 2",
                "data": [
                  86.59636488, -80.36694102, -91.98045267, 61.63237311,
                  -83.72599451, 89.22839506, -31.85013717
                ],
                "borderColor": "rgb(54, 162, 235)",
                "yAxisID": "y1"
              }
            ]
          },
          "options": {
            "responsive": true,
            "interaction": { "mode": "index", "intersect": false },
            "stacked": false,
            "plugins": {
              "title": {
                "display": true,
                "text": "Chart.js Line Chart - Multi Axis"
              }
            },
            "scales": {
              "y": { "type": "linear", "display": true, "position": "left" },
              "y1": {
                "type": "linear",
                "display": true,
                "position": "right",
                "grid": { "drawOnChartArea": false }
              }
            }
          }
        }
      ]
    }
  ]
}
Schema
This section covers the requirements for passing your Chart.js data for the
custom visual asset to the content property. The schema requirements for
defining a custom visual asset can be found on the Overview
page.
The Chart.js data that is passed to content should be an array of objects with
the following top-level properties:
-
typeThe type property defines which type of chart should be rendered. It must be one of Chart.js’s
ChartTypes:barlinescatterbubblepiedoughnutpolarArearadar
The type defined here is passed to Chart.js’s type parameter when rendering the chart.
-
dataThe data used for rendering Chart.js charts. The data defined here is passed to Chart.js’s data parameter when rendering the chart.
-
options(Optional) Settings defined in the
optionsproperty are passed to Chart.js’s options parameter when rendering the plot. Nextmv Console defines only one layout setting by default:{ aspectRatio: 2.2, responsive: true, plugins: { tooltip: { animation: false, backgroundColor: theme.color.gray700T, bodyFont: <Nextmv-specific font style>, boxPadding: 3, cornerRadius: 5, padding: { top: 6, right: 9, bottom: 6, left: 8 }, titleFont: <Nextmv-specific font style>, }, }, }You can override these default layout options by passing options of your own with the same names (all layout properties are Chart.js-specific, there are no Nextmv-specific layout options). However, it is not recommended to override the
responsive: truesetting as it can adversely affect the rendering of your chart.
The custom data passed to content will have this shape then:
{
  "version": {...},
  "solutions": [...],
  "statistics": {...},
  "assets": [
    {
      "name": "Chart.js example",
      "content_type": "json",
      "visual": {
        "schema": "chartjs",
        "type": "custom-tab",
        "label": "Charts"
      },
      "content": {
        "type": ...,
        "data": [...],
        "options": {...}
      }
    }
  ]
}
Note that if multiple objects are included in the content array then each
object will be rendered as its own Chart.js chart. That is, you can render
multiple Chart.js charts in a single custom view.