GeoJSON
GeoJSON is a widely-recognized standard for defining
geospatial data. You can define points, lines, polygons and more, as well as
take advantage of the generic properties schema to add custom styles and pin
metadata to the rendered features.
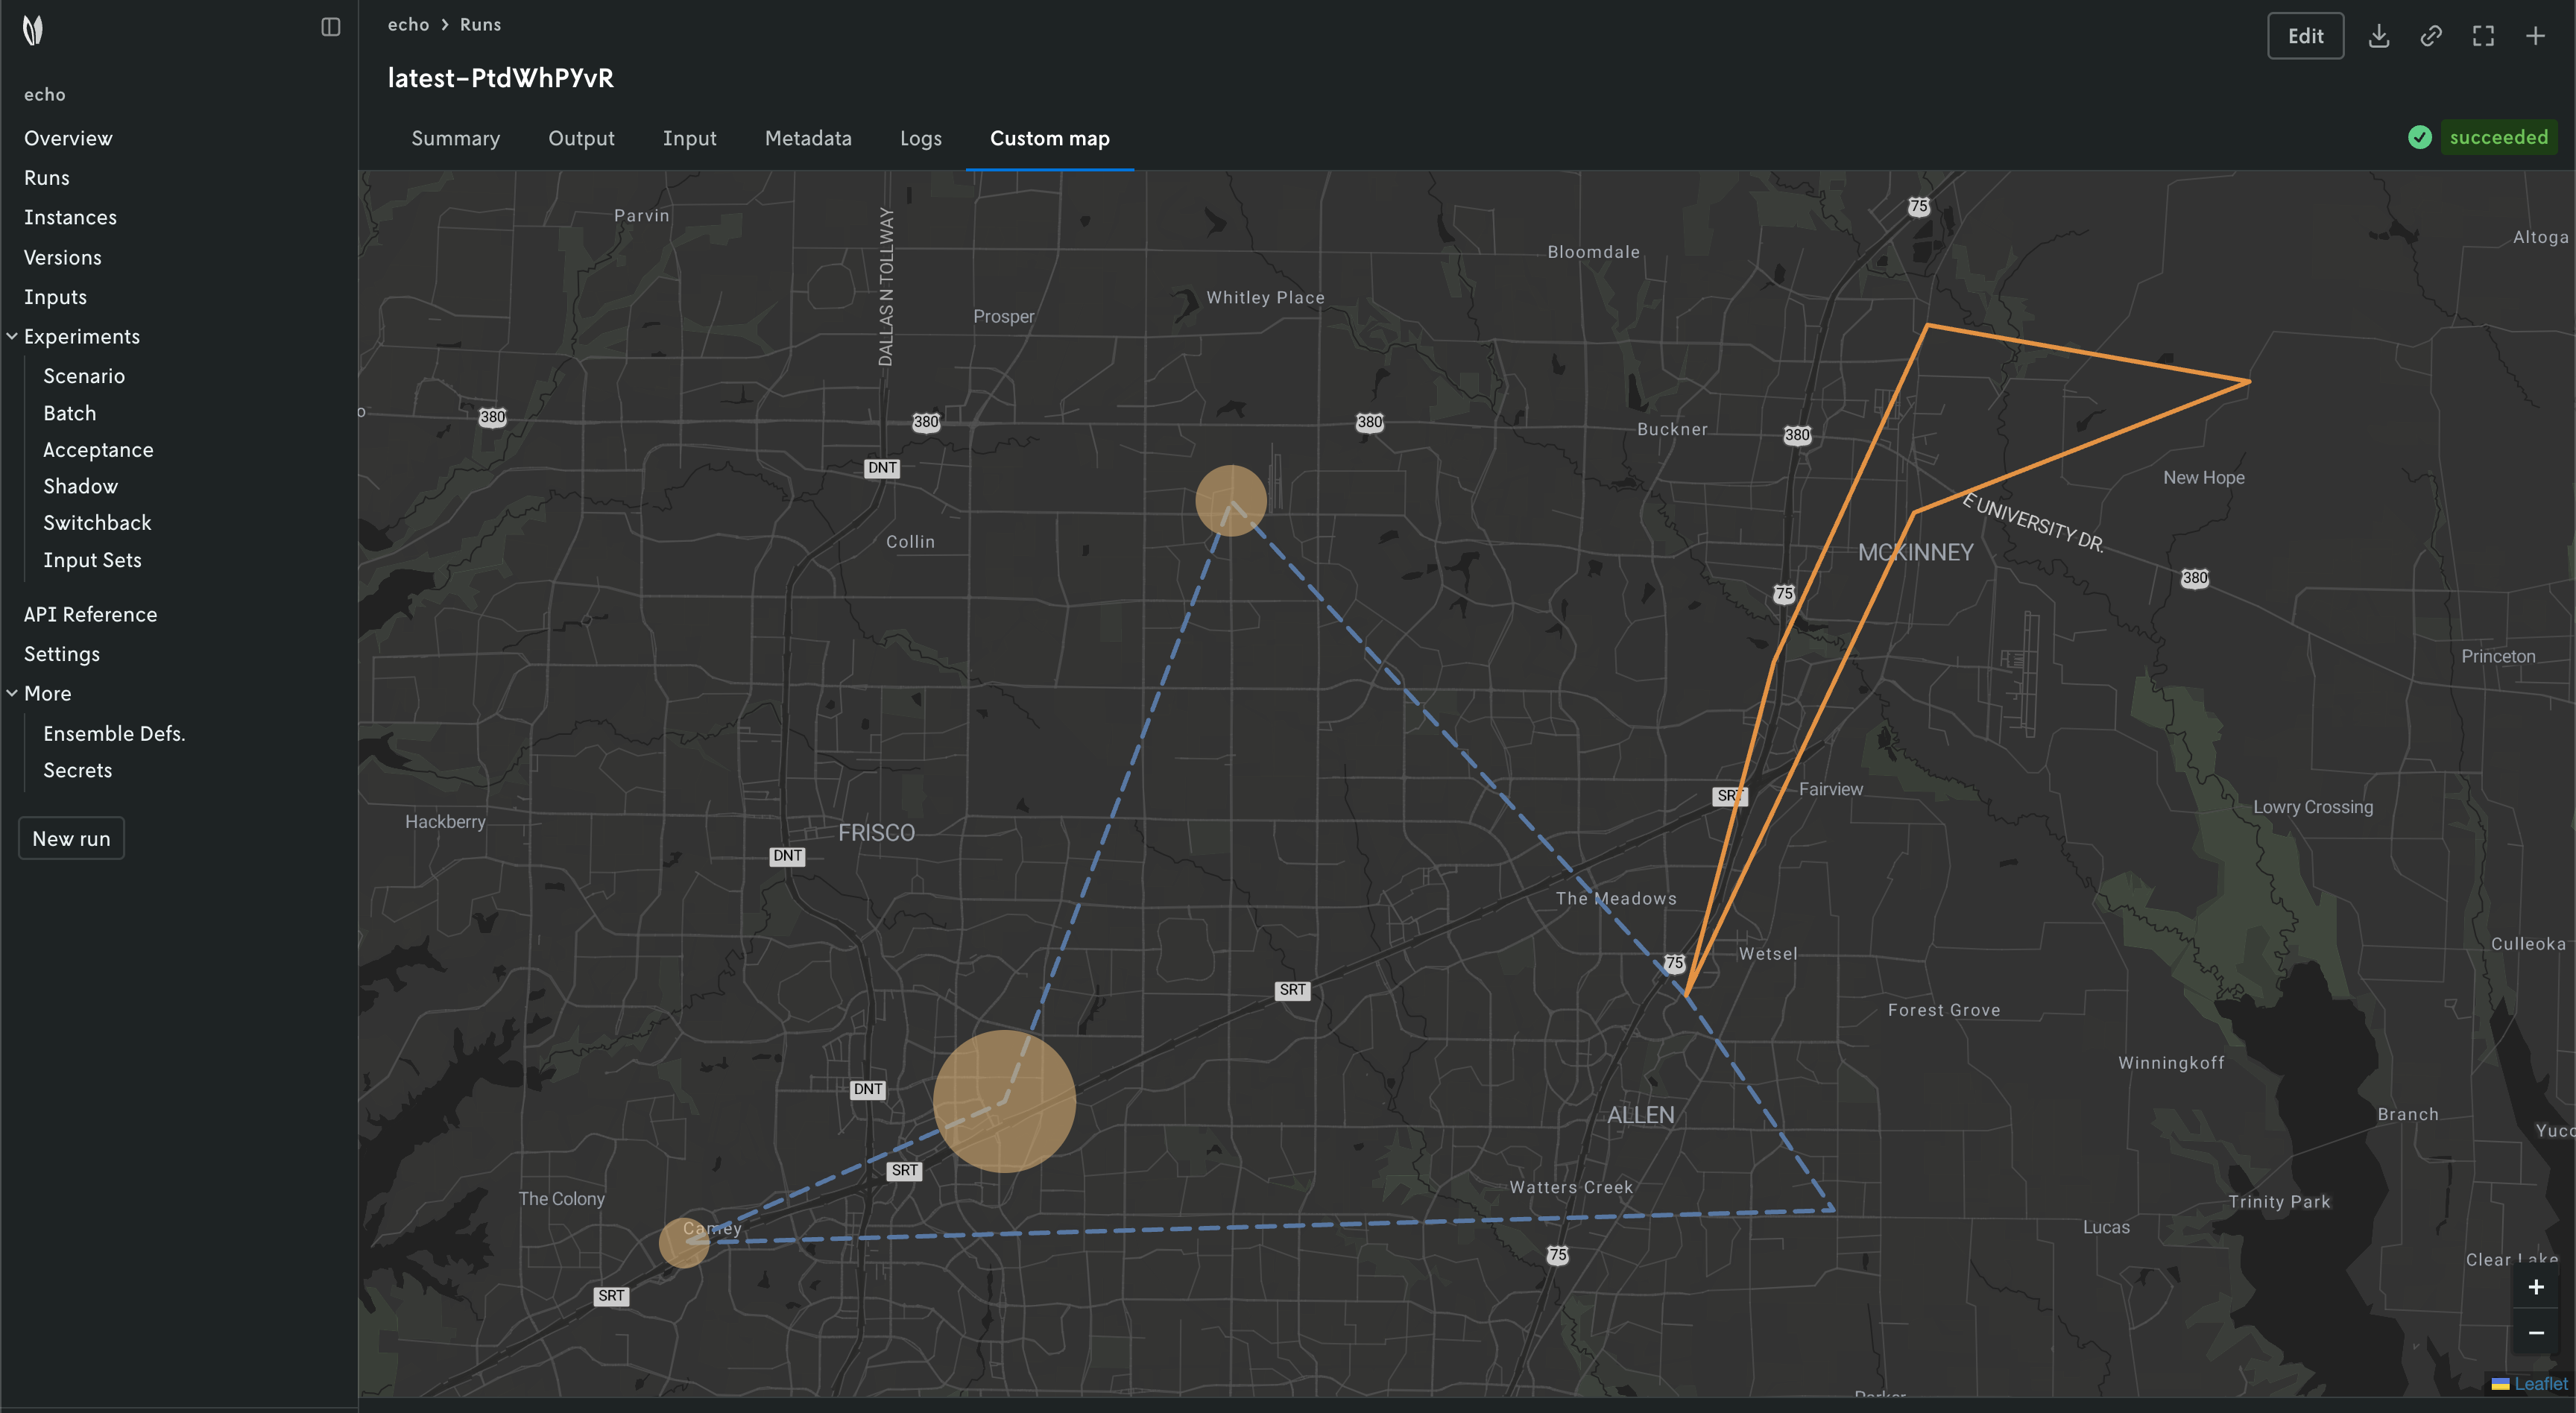
To view a quick demo of the custom GeoJSON visual, use the example echo
app to run the input below.
{
  "assets": [
    {
      "name": "GeoJSON example",
      "content_type": "json",
      "visual": {
        "schema": "geojson",
        "type": "custom-tab",
        "label": "Custom map"
      },
      "content": {
        "type": "FeatureCollection",
        "features": [
          {
            "id": "route-1",
            "type": "Feature",
            "geometry": {
              "type": "LineString",
              "coordinates": [
                [-96.659222, 33.122746],
                [-96.750382, 33.205808],
                [-96.795869, 33.104921],
                [-96.860071, 33.081335],
                [-96.629515, 33.086701],
                [-96.659222, 33.122746]
              ]
            },
            "properties": {
              "metadata": [
                { "key": "Distance (m)", "value": 91206 },
                { "key": "Route duration (sec)", "value": 6151 },
                { "key": "Stop duration", "value": 720 },
                { "key": "Total duration", "value": 6871 }
              ],
              "style": { "color": "#4e79a7", "weight": 3, "dashArray": "12,7" }
            }
          },
          {
            "id": "route-2",
            "type": "Feature",
            "geometry": {
              "type": "LineString",
              "coordinates": [
                [-96.659222, 33.122746],
                [-96.613565, 33.203797],
                [-96.546137, 33.225914],
                [-96.610598, 33.235287],
                [-96.641374, 33.178801],
                [-96.659222, 33.122746]
              ]
            },
            "properties": {
              "metadata": [
                { "key": "Distance (m)", "value": 48237 },
                { "key": "Route duration (sec)", "value": 3128 },
                { "key": "Stop duration", "value": 480 },
                { "key": "Total duration", "value": 3608 }
              ],
              "style": { "color": "#f28e2c", "weight": 3 }
            }
          },
          {
            "id": "location-1",
            "type": "Feature",
            "geometry": {
              "type": "Point",
              "coordinates": [-96.750382, 33.205808]
            },
            "properties": {
              "metadata": [
                { "key": "my_value", "value": 1243 },
                { "key": "some_other_value", "value": 123 }
              ],
              "style": {
                "fillColor": "#fdbf6f",
                "fillOpacity": 0.5,
                "radius": 24,
                "weight": 0
              }
            }
          },
          {
            "id": "location-10",
            "type": "Feature",
            "geometry": {
              "type": "Point",
              "coordinates": [-96.795869, 33.104921]
            },
            "properties": {
              "metadata": [
                { "key": "my_value", "value": 1243 },
                { "key": "some_other_value", "value": 123 }
              ],
              "style": {
                "fillColor": "#fdbf6f",
                "fillOpacity": 0.5,
                "radius": 48,
                "weight": 0
              }
            }
          },
          {
            "id": "location-8",
            "type": "Feature",
            "geometry": {
              "type": "Point",
              "coordinates": [-96.860071, 33.081335]
            },
            "properties": {
              "metadata": [
                { "key": "my_value", "value": 1243 },
                { "key": "some_other_value", "value": 123 }
              ],
              "style": {
                "fillColor": "#fdbf6f",
                "fillOpacity": 0.5,
                "radius": 17,
                "weight": 0
              },
              "vehicleId": "vehicle-1"
            }
          }
        ]
      }
    }
  ]
}
Schema
This section covers the requirements for passing your GeoJSON data for the
custom visual asset to the content property. The schema requirements for
defining a custom visual asset can be found on the Overview
page.
The GeoJSON data sent as a custom visual is rendered on our standard map view, which is powered by Leaflet. The map view will render the following GeoJSON types:
PointMultiPointLineStringMultiLineStringPolygonMultiPolygon
All GeoJSON types except for Point are rendered using Leaflet’s geoJSON
method. Leaflet’s GeoJSON documentation is a good
resource for learning what else you can do with the standard GeoJSON schema
beyond just standard rendering (e.g. adding custom styles to features).
GeoJSON Point features are passed through the supercluster
library to help with browser rendering. That is, the
points are extracted from your GeoJSON data and then rendered with a clustering
engine by default. However, note that you can still customize the individual
point styles as outlined in Leaflet’s GeoJSON
documentation.
The custom data that is passed to content must be in the form of a single
GeoJSON FeatureCollection type. And the feature collection’s features
property is where the GeoJSON data is defined. So a GeoJSON custom visual asset
would look like this:
{
  "version": {...},
  "solutions": [...],
  "statistics": {...},
  "assets": [
    {
      "name": "GeoJSON Example",
      "description": "Optional content displayed as a UI tooltip.",
      "content_type": "json",
      "visual": {
        "schema": "geojson",
        "type": "custom-tab",
        "label": "Custom Plot"
      },
      "content": {
        "type": "FeatureCollection",
        "features": [
          <your GeoJSON features>
        ]
      }
    }
  ]
}
Currently you can only define one map view per custom visual. If you need multiple maps it is recommended to either combine the GeoJSON data and distinguish the features with different styles or just create multiple custom visuals for as many maps as you need.
Extending GeoJSON schema
The standard GeoJSON schema can be extended for Nextmv’s custom map visual with
two properties style and metadata defined in the GeoJSON properties object.
(Note: The properties key in GeoJSON schema is reserved for arbitrary data that
parsers can choose to use or not.)
As mentioned prior, custom styles can be applied to features by defining them in
property.style:
{
  ...
  "assets": [
    {
      ...
      "content": {
        "type": "FeatureCollection",
        "features": [
          {
            "type": "Feature",
            ...
            "properties": {
              "style": {
                "color": "#4e79a7",
                "weight": 3,
                "dashArray": "12,7"
              }
            }
          }
        ]
      }
    }
  ]
}
Which custom styles and how they are applied is decided by Leaflet’s rendering engine. See Leaflet’s GeoJSON docs for more information.
You can also add viewable metadata to a feature by adding the data to the
properties.metadata as an array of objects each with a key and value
property. The key property must be a string and the value property must be a
string or number.
{
  ...
  "assets": [
    {
      ...
      "content": {
        "type": "FeatureCollection",
        "features": [
          {
            "type": "Feature",
            ...
            "properties": {
              "metadata": [
                { "key": "Distance (m)", "value": 91206 },
                { "key": "Route duration (sec)", "value": 6151 },
                { "key": "Stop duration", "value": 720 },
                { "key": "Total duration", "value": 6871 }
              ]
            }
          }
        ]
      }
    }
  ]
}
If a feature is clicked then a popup will appear with the metdata information displayed.